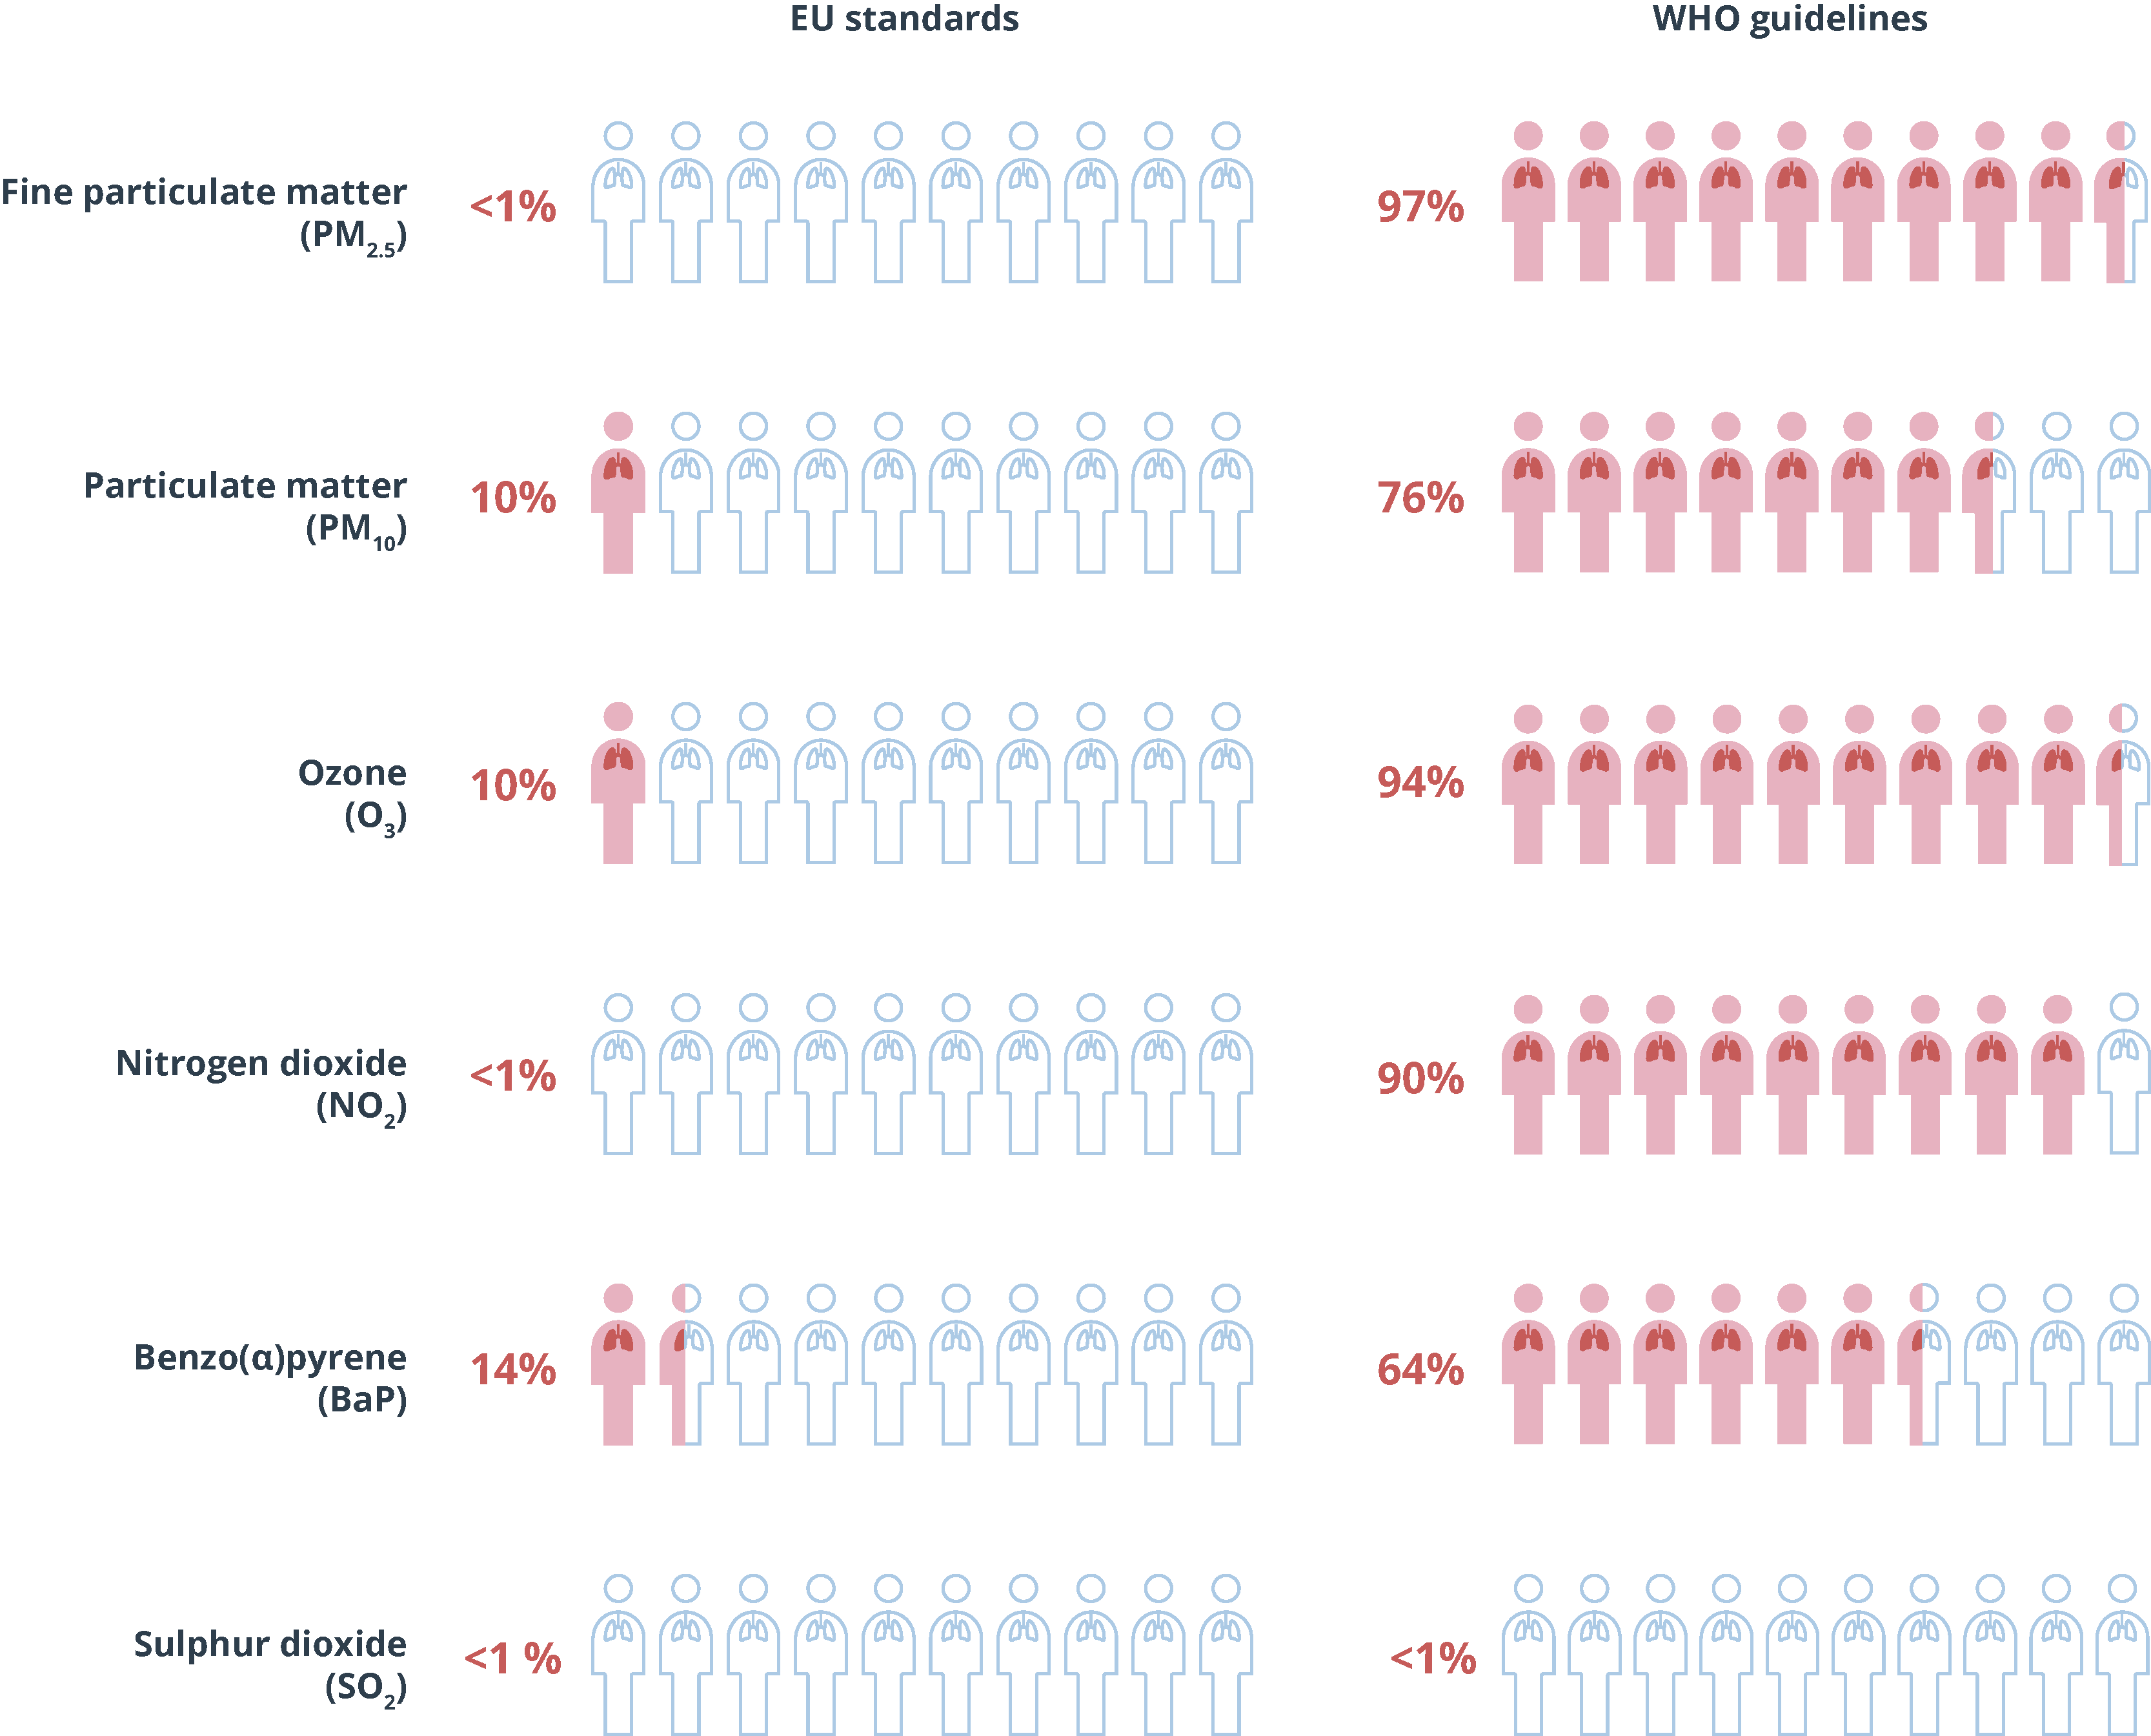
Despite reductions in emissions, in 2021 most of the EU’s urban population was exposed to levels of key air pollutants that are damaging to health (see Figure 1). In particular, 97% of the urban population was exposed to concentrations of fine particulate matter (PM2.5) above the 2021 WHO annual guideline of 5 µg/m3.
This analysis highlights those pollutants deemed to be most harmful to human health or that exceed the EU air quality standards and WHO guideline levels most frequently. The concentrations are obtained from measurements in monitoring stations that are officially reported to the EEA by its member and other collaborating countries. The classification of the monitoring stations and the criteria used to determine their inclusion in the analysis are described here. The number of countries that submitted data and the number of monitoring stations with the minimum data coverage required vary for each pollutant and are summarised in Table 1 for 2021, and Table 2 for 2022. When referring to countries reporting data above certain levels, it means that they reported at least one station with concentrations above those levels.
The 2021 data were extracted from the EEA’s reporting system on 13 February 2023 and the 2022 data on 20 March 2023.
The analysis for 2021 is based on officially validated data reported by countries. The analysis for 2022 is based on provisional up-to-date (UTD) data, and may therefore be subject to change once the set of fully validated data is received by the EEA, and more countries are considered. Validated data for 2022 will only be available later in 2023 and presented in the 2024 briefing.
Additional information and further analysis can be found in the Eionet status reports ETC/HE 2023/1 and ETC/HE 2023/2, prepared by the European Topic Centre on Human health and the environment (ETC HE).
Further information on the concentrations of air pollutants, including those for previous years, can be found at the EEA's statistics viewer, and data can be downloaded here.
Apart from the measurements from monitoring stations, some countries also reported 2021 official data from modelling applications, that are available at https://eeadmz1-cws-wp-air02.azurewebsites.net/index.php/users-corner/modeling-results-viewer/. The results from these modelling applications have been included in this analysis when they implied concentrations above the EU standards.
PM10 stands for particulate matter with a diameter of 10 µm or less. PM10 are emitted mainly by the combustion of solid fuels for domestic heating, while industrial activities, agriculture and road transport are also important sources. Some also come from natural sources such as sea salt, Saharan dust or volcanos, and some (called secondary PM) are formed in the atmosphere from the combination of different gases (as for instance, ammonia and nitrogen dioxide).
Concentrations above the EU daily limit value for PM10 are seen mainly in Italy and some eastern European countries (Figures 2 and 4). In most central and eastern European countries, solid fuels such as coal are widely used for heating households and in some industrial facilities and power plants. The Po Valley, in northern Italy, is a densely populated and industrialised area with specific meteorological and geographical conditions that favour the accumulation of air pollutants in the atmosphere.
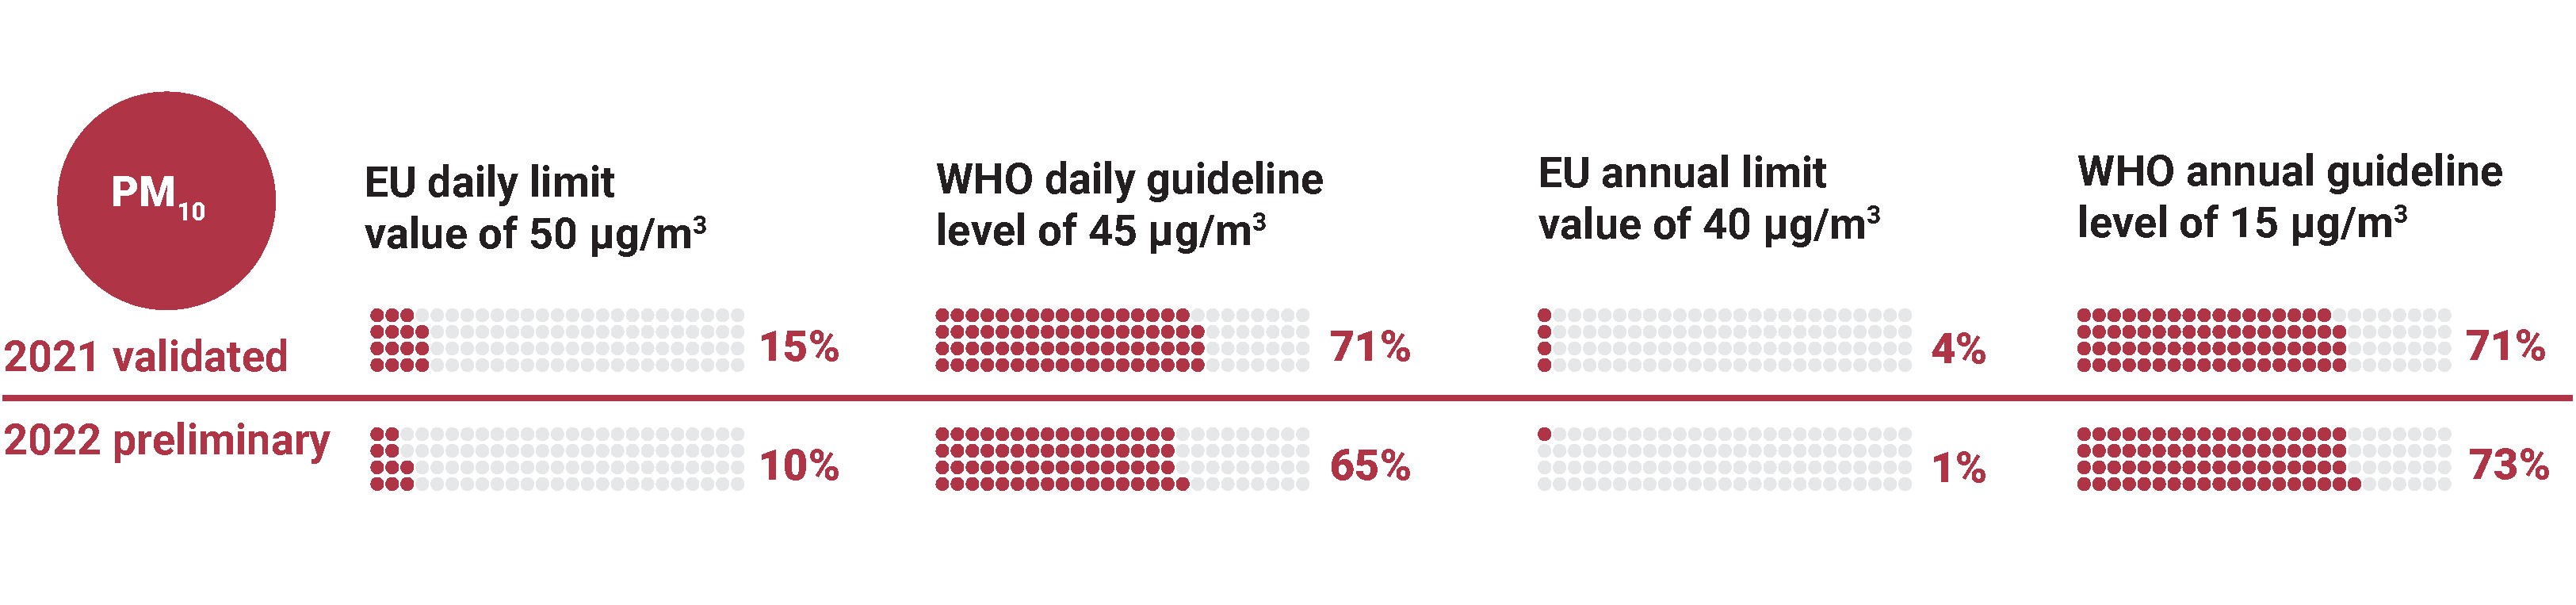
Figure 2. Concentrations of PM10 in 2021 and 2022 in relation to the EU daily limit value
Note: The map shows the 90.4 percentile of the PM10 daily mean concentrations, representing the 36th highest value in a complete series. It is related to the PM10 daily limit value, allowing 35 exceedances of the 50 µg/m3 threshold over one year.
Concentrations of PM10 in 2021:
- 21 reporting countries, including 15 EU Member States, registered concentrations above the EU daily limit value of 50 µg/m3
- 11 reporting countries, including 6 EU Member States, registered concentrations above the EU annual limit value of 40 µg/m3
- All 37 reporting countries registered concentrations above the WHO daily guideline level of 45 µg/m3
- All reporting countries except Iceland registered concentrations above the WHO annual guideline level of 15 µg/m3

Concentrations of PM10 above the EU daily limit value were measured at 15% of monitoring stations (Figure 3), 86% of which were urban and 10% suburban.
Furthermore, Italy and Poland reported exceedances of the PM10 daily limit value based on assessment models for 7 and 24 air quality zones, respectively.
Note: The figure shows, per country, the concentrations of each reported station, the minimum and maximum concentrations, the median and the percentiles 25 (“Lower Hinge”) and 75 (“Upper Hinge”) of all the measurements.
Concentrations of PM10 in 2022:
- 20 reporting countries, including 15 EU Member States, reported concentrations above the daily limit value
- 4 reporting countries, including 2 EU Member States, reported concentrations above the annual limit value
- All 34 reporting countries reported concentrations above the WHO daily guideline level
- All reporting countries reported concentrations above the WHO annual guideline level
PM2.5 stands for particulate matter with a diameter of 2.5 µm or less. These particles are emitted mainly from the combustion of solid fuels for domestic heating, industrial activities and road transport. As with PM10, they can also come from natural sources and can be formed in the atmosphere. Agricultural emissions of ammonia make a significant contribution to the formation of fine particulate matter in the atmosphere.
The highest PM2.5 concentrations were seen in northern Italy and some eastern European countries (Figures 5 and 7). As for PM10, the use of solid fuels is the main reason for the situation in central and eastern Europe, together with an older vehicle fleet. In northern Italy, the high concentrations are due to the combination of a high density of anthropogenic emissions and meteorological and geographical conditions that favour the accumulation of air pollutants in the atmosphere and the formation of secondary particles.
Concentrations of PM2.5 in 2021:
- 8 reporting countries, including 4 EU Member States, registered concentrations above the EU annual limit value of 25 µg/m3
- All 37 reporting countries registered concentrations above the WHO annual guideline level of 5 µg/m3
- All reporting countries registered concentrations above the WHO daily guideline level of 15 µg/m3
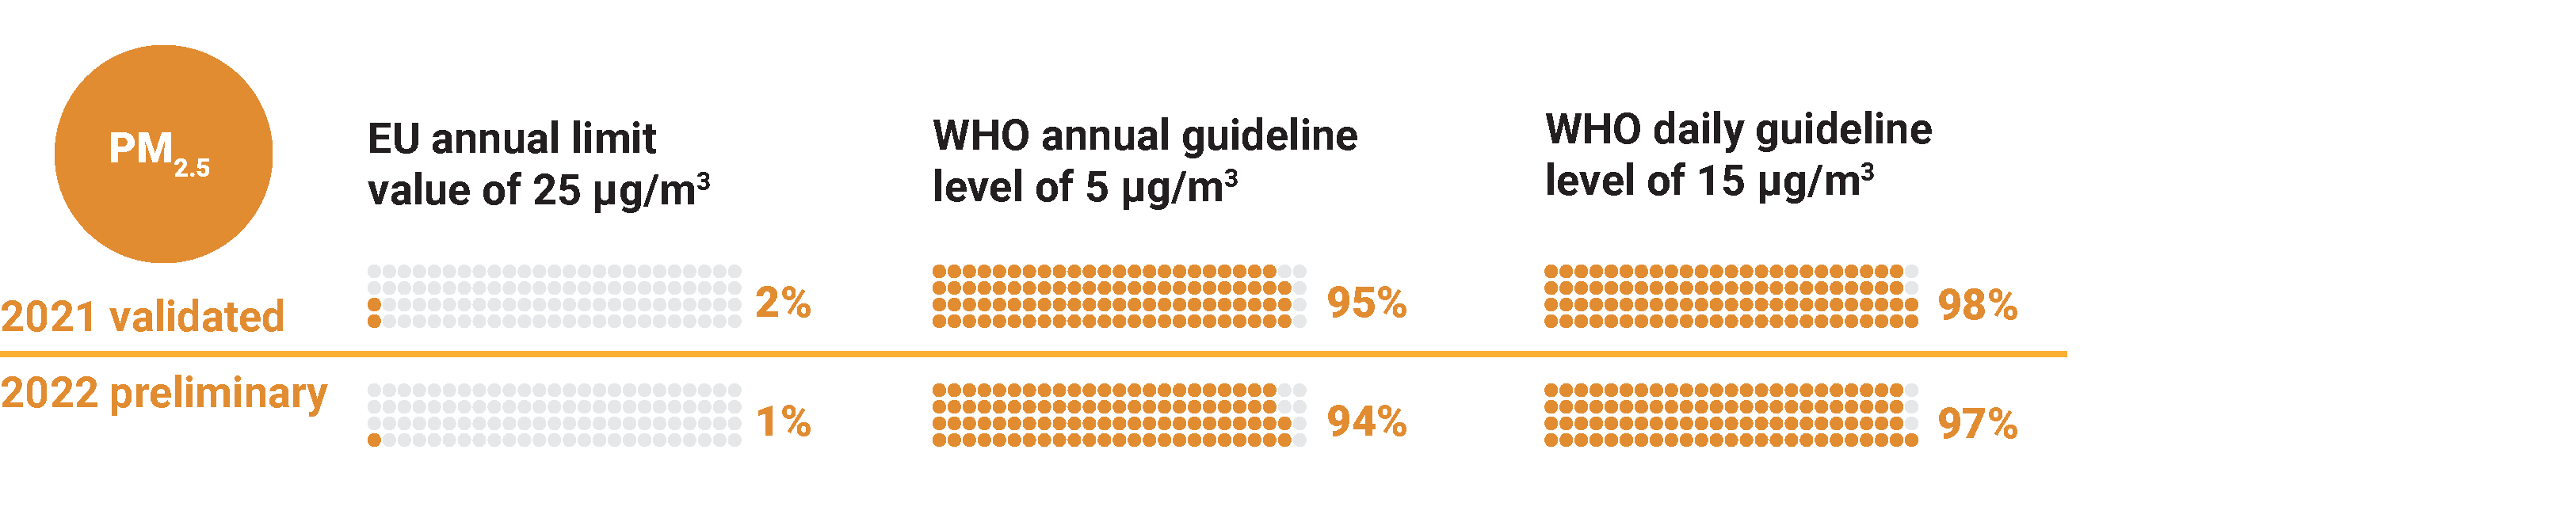
Concentrations of PM2.5 above the EU annual limit value were registered at 2% of monitoring stations (Figure 6), 72% of which were urban and 23% suburban.
Furthermore, Italy and Poland reported exceedances of the PM2.5 annual limit value based on assessment models for 5 and 46 air quality zones, respectively.
In 2021, all EU Member States continued to meet the exposure concentration obligation of 20 µg/m3, based on a 3-year average (2019-2021) measured at urban background stations, that was to be attained as of 2015 under the Ambient Air Quality Directive. Furthermore, only Romania did not meet the national exposure reduction target set for 2020. This indicator assesses the long-term exposure of the general population in urban areas.
Note: The figure shows, per country, the concentrations of each reported station, the minimum and maximum concentrations, the median and the percentiles 25 (“Lower Hinge”) and 75 (“Upper Hinge”) of all the measurements.
Concentrations of PM2.5 in 2022:
- 5 reporting countries, including 2 EU Member States, registered concentrations above the EU annual limit value
- All 33 reporting countries, except Iceland, registered concentrations above the WHO annual guideline level
- All 32 reporting countries[1] registered concentrations above the WHO daily guideline level
An increase in PM levels could be expected in 2022 from the expected increase in the use of wood and coal as fuel, as a result of the energy crisis and higher gas prices seen in that period. Nevertheless, the data presented here are 2022 annual averages, and the beginning of the winter 2022-2023 was milder than usual in Europe.
Ozone (O3) is a pollutant formed in the atmosphere when heat and light cause chemical reactions between nitrogen oxides and volatile organic compounds (VOCs), including methane. Emissions of these gases occur from anthropogenic sources and, in the case of VOCs, also biogenic. Ozone also is transported to Europe from other parts of the northern hemisphere and from the upper atmosphere. Meteorology plays an important role in the formation and dispersion of air pollution and in interannual variation in concentrations, and this effect is especially significant for ozone.
Note: The map shows the 93.2 percentile of the O3 maximum daily eight−hour mean, representing the 26th highest value in a complete series. It is related to the O3 target value.
Data are presented here for one year only, not the average over a three-year period as stated in the definition of the EU target value for O3.
The highest concentrations in 2021 were found in some Mediterranean and Eastern countries (Figures 8 and 10).
Concentrations of O3 in 2021:
- 22 reporting countries, including 16 EU Member States, registered levels above the EU target value threshold of 120 µg/m3
- All 35 reporting countries[2] registered levels above the WHO peak season guideline level of 60 µg/m3
- All 35 reporting countries[2] registered levels above the WHO guideline level of 100 µg/m3
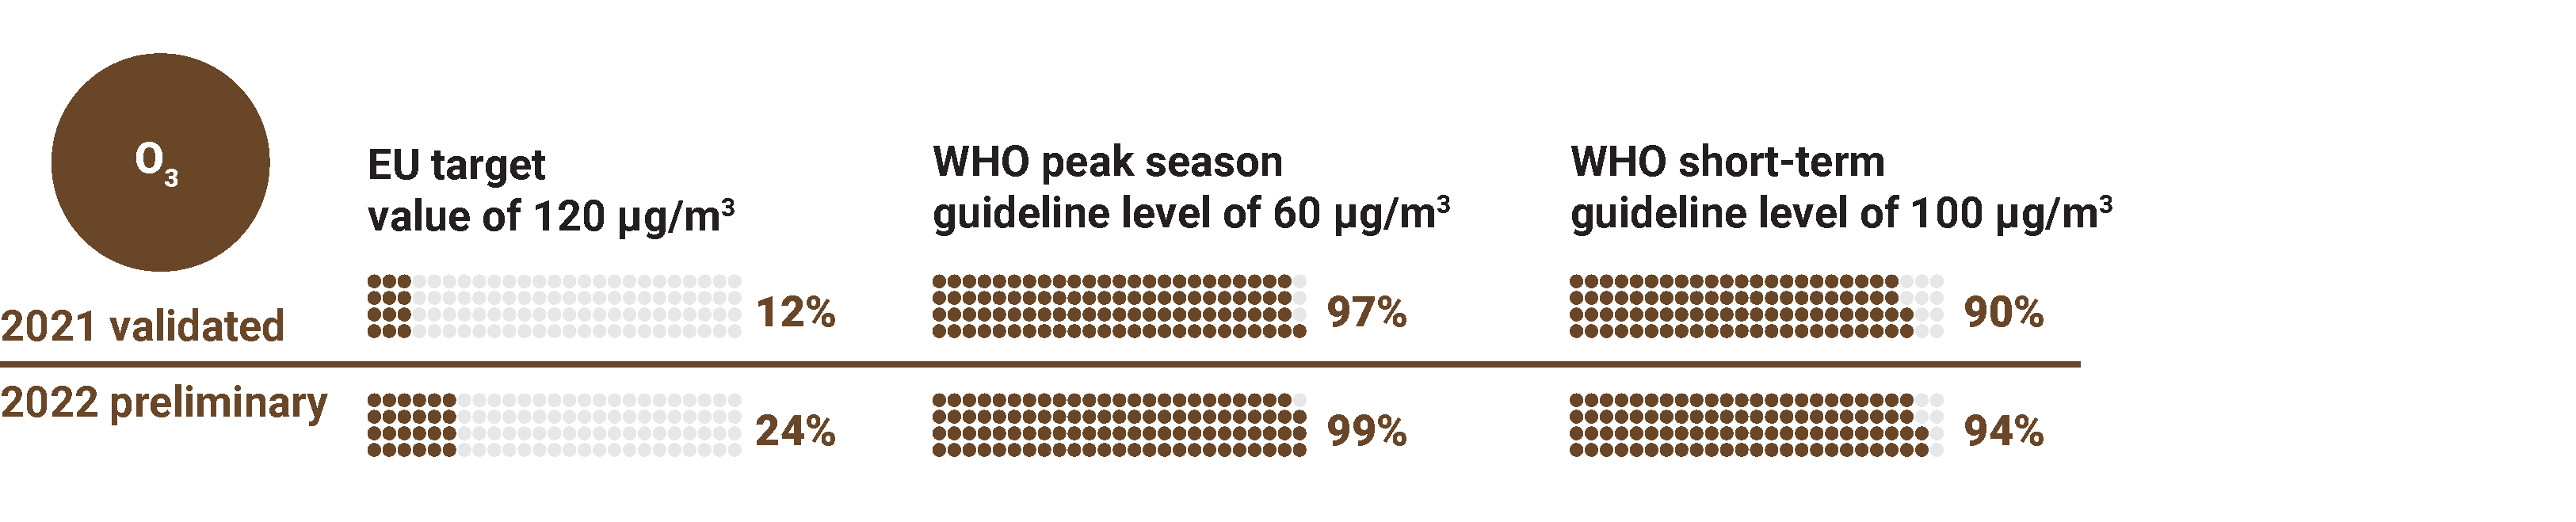
The long-term EU objective for ozone of 120 µg/m3 was met at 21% of monitoring stations in 2021, with all reporting countries reporting stations with concentrations above the long-term objective.
Italy reported exceedances of the O3 target value for the protection of health based on assessment models for 2 air quality zones. Italy and Poland reported exceedances of the O3 long-term objective for the protection of health for 5 and 42 air quality zones, respectively.
Note: The figure shows, per country, the concentrations of each reported station, the minimum and maximum concentrations, the median and the percentiles 25 (“Lower Hinge”) and 75 (“Upper Hinge”) of all the measurements.
Data are presented here for one year only, not the average over a three-year period as stated in the definition of the EU target value for O3.
Concentrations of O3 in 2022:
- 20 reporting countries, including 18 EU Member States, registered concentrations above the EU target value threshold
- All 31 reporting countries registered levels above the WHO short-term guideline level
- All 30 reporting countries[3] registered levels above the WHO peak season guideline level
In 2022, the long-term EU objective for ozone was met at 12% of monitoring stations, with all 31 reporting countries registering concentrations above the long-term objective.
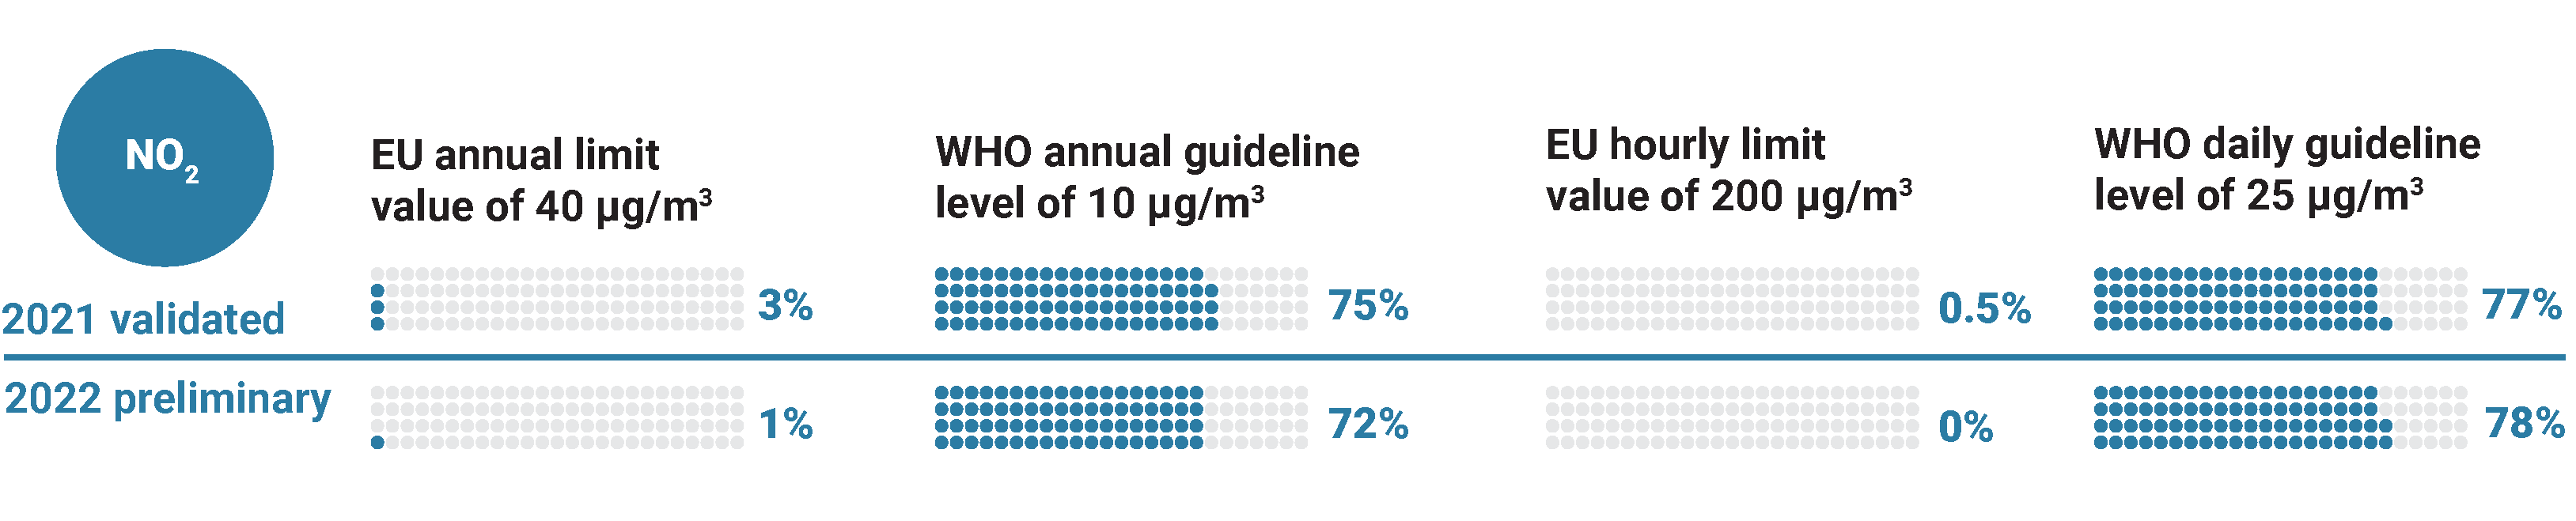
The main source of nitrogen dioxide (NO2) is road transport, which emits NO2 close to the ground, mostly in densely populated areas, contributing to population exposure. Other important sources are combustion processes in industry and energy supply.
The highest concentrations were found in some big cities with a high volume of traffic (Figures 11 and 13). In general, maximum annual concentrations of NO2 continued to fall in 2021 and 2022. In areas where maximum values have increased, they have not reached the levels observed before COVID-19.
Concentrations of NO2 in 2021:
- 11 reporting countries, including 9 EU Member States, registered concentrations above the EU annual limit value of 40 µg/m3
- All 37 reporting countries registered concentrations above the WHO annual guideline level of 10 µg/m3
- All 37 reporting countries registered concentrations above the WHO daily guideline level of 25 µg/m3
Concentrations of NO2 above the EU annual limit value were registered at 3% of all monitoring stations (Figure 12), 75% of which were traffic stations.
Belgium, Italy and Poland reported exceedances of the NO2 annual limit value based on assessment models for 2, 1 and 4 air quality zones, respectively.
Note: The figure shows, per country, the concentrations of each reported station, the minimum and maximum concentrations, the median and the percentiles 25 (“Lower Hinge”) and 75 (“Upper Hinge”) of all the measurements.
Concentrations of NO2 in 2022
- 9 reporting countries, all of them EU Member States, registered values above the annual limit value
- All 35 reporting countries registered values above the WHO annual guideline level
- All 34 reporting countries[1] registered values above the WHO daily guideline level
Concentrations of NO2 above the annual limit value were registered at 1% of monitoring stations, all of which were traffic stations.
Benzo[a]pyrene (BaP) is a carcinogenic pollutant emitted mainly from the combustion of coal and wood for heating and, to a lesser extent, from the combustion of agricultural waste, and industrial installations.
The highest concentrations were found in eastern Europe (Figures 14 and 15), where the use of coal and other solid fuels for residential heating is widespread.
Concentrations of Benzo[a]pyrene in 2021:
- 13 out of 28 reporting countries, all of which were EU Member States, registered values above 1.0 ng/m3
Concentrations above 1.0 ng/m3 were registered at 27% of the reported monitoring stations, the majority of which were urban (78%) or suburban (17%).
Greece and Poland reported exceedances of the BaP target value based on assessment models for 3 and 38 air quality zones, respectively.
Note: The figure shows, per country, the concentrations of each reported station, the minimum and maximum concentrations, the median and the percentiles 25 (“Lower Hinge”) and 75 (“Upper Hinge”) of all the measurements.
Concentrations of sulphur dioxide (SO2) in 2021:
- 5 out of 37 reporting countries[4], including one EU Member State, registered levels above the EU daily limit value of 125 µg/m3
- 19 countries, including 12 EU Member States, registered values above the WHO daily guideline level of 40 µg/m3 [5]
In 2021, concentrations above the EU daily limit value were registered at 1% of reporting monitoring stations.
Poland reported exceedances of the SO2 daily limit value based on assessment models for 1 air quality zone.
In 2022, concentrations of SO2 above the EU daily limit value were registered in only one reporting station outside the EU (in Serbia). In the same year, concentrations above the WHO daily guideline level were registered in 10 countries (including 7 EU Member States), out of 33 reporting countries.
Concentrations above EU limit/target values, were registered in 2021 for the following:
- Carbon monoxide in four stations located in one EU Member State (Italy, two stations) and two non-EU Member States (Serbia and Türkiye, one station each), out of 34 reporting countries.
- Benzene in one station in a EU Member State (Romania), out of 28 reporting countries. (Italy reported exceedances of the benzene annual limit value based on assessment models for 1 air quality zone).
- Lead in one station in a EU Member State (Slovenia), out of 30 reporting countries.
- Arsenic in five stations located in three EU Member States (Belgium, Poland and Finland), out of 30 reporting countries. (Poland reported exceedances of the arsenic annual target value based on assessment models for 1 air quality zone).
- Cadmium in one station located in a EU Member State (Italy), out of 29 reporting countries.
- Nickel in three stations located in three countries (two EU Member States, Finland and France; plus Norway), out of 30 reporting countries.

Document Actions
Share with others