All official European Union website addresses are in the europa.eu domain.
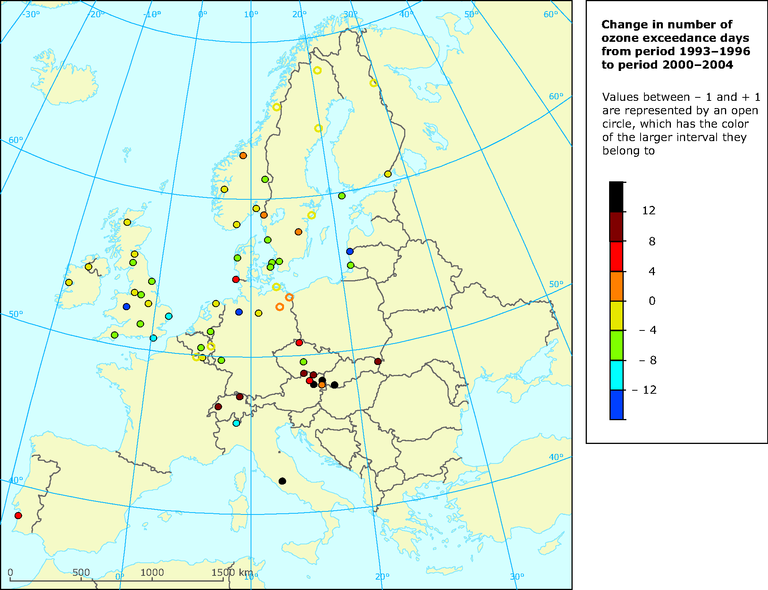
See all EU institutions and bodiesThe map shows the change in the average number of ozone exceedence days from April to September observed at regional background stations (EMEP monitoring stations) from the period 1990-1994 to the period 1999-2004, excluding the abnormally warm summer of 2003. A day is counted as an exceedence day when the daily maximal 8-hr-average ozone concentration exceeds 60 ppbV.
Loading

