All official European Union website addresses are in the europa.eu domain.
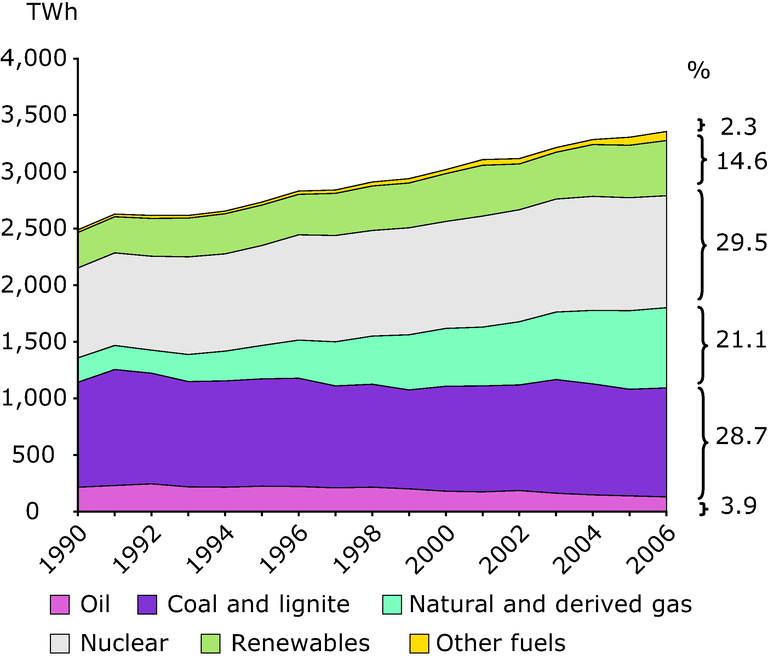
See all EU institutions and bodiesGross electricity production by fuel, EU-27
Chart (static)
Data shown are for gross electricity production and include electricity production from both public and auto-producers

- Austria
- Belgium
- Bulgaria
- Cyprus
- Czechia
- Denmark
- Estonia
- Finland
- France
- Germany
- Greece
- Hungary
- Ireland
- Italy
- Latvia
- Lithuania
- Luxembourg
- Malta
- Netherlands
- Poland
- Portugal
- Romania
- Slovakia
- Slovenia
- Spain
- Sweden
- United Kingdom
Renewables includes electricity produced from hydro (excluding pumping), biomass, municipal waste, geothermal, wind and solar PV. The share of renewables presented in the chart is that for production and hence does not correspond to the share, for consumption, as required by Directive 2001/77/EC. The difference between both shares is accounted for by the net balance between imports and exports of electricity. The EU-27 value for 1990 includes (former) West Germany only and since 1991 it refers to Germany. More than half of the increase in electricity generation in the EU-27 in 1991 was accounted for by Germany alone, compared to just 10 % over 1991-2006. 'Other fuels' include electricity produced from power plants not accounted for elsewhere, such as those fuelled by certain types of industrial wastes. It also includes the electricity generated as a result of pumping in hydro-power stations.
