All official European Union website addresses are in the europa.eu domain.
See all EU institutions and bodiesAn official website of the European Union | How do you know?
Environmental information systems
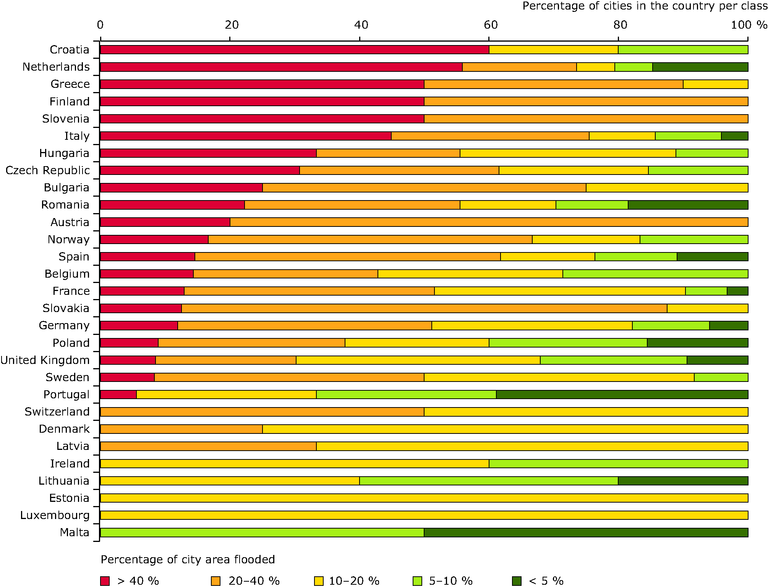
Percentage of the urban area that would be flooded — share of cities per class per country
Chart (static)
The diagram shows the proportion of cities per country that fall in a particular class regarding the percentage of potentially flooded area.

Downloads
Data sources
Metadata
More info
Loading
- Austria
- Belgium
- Bulgaria
- Cyprus
- Czechia
- Denmark
- Estonia
- Finland
- France
- Germany
- Greece
- Hungary
- Ireland
- Italy
- Latvia
- Lithuania
- Luxembourg
- Malta
- Netherlands
- Norway
- Poland
- Portugal
- Romania
- Slovakia
- Slovenia
- Spain
- Sweden
- United Kingdom
2006
Methodology
1) Potential flood areas by 1 m water rise were delineated for all Europe according to ETC/LUSI (2010). 2) Cities were defined by clipping UMZs inside Core City of Urban Audit. 3) Resulting layers of step 1 and step 2 were crossed and, for each city (according definition in step 2) intersected area was calculated. 4) For each city, flooded area (step 3) was divided by total area (part of the UMZ inside the core city of Urban Audit) in order to obtain the percentage. 5) Percentages obtained from the cities were grouped by quartiles and grouped by country.
