The atmospheric concentration of GHGs and other forcing agents, including cooling aerosols, reached 477ppm CO2 equivalents in 2022. This is close to the upper limit of the peak level that the IPCC states peak level 'should not be exceeded if — with a 67% likelihood and not allowing a temperature overshoot — the global temperature increase is to be limited to 1.5oC above pre-industrial levels'. When allowing for an overshoot, the peak level could be exceeded before 2028. The peak concentrations corresponding to a temperature increase of 2oC by 2100 could be exceeded before 2032.
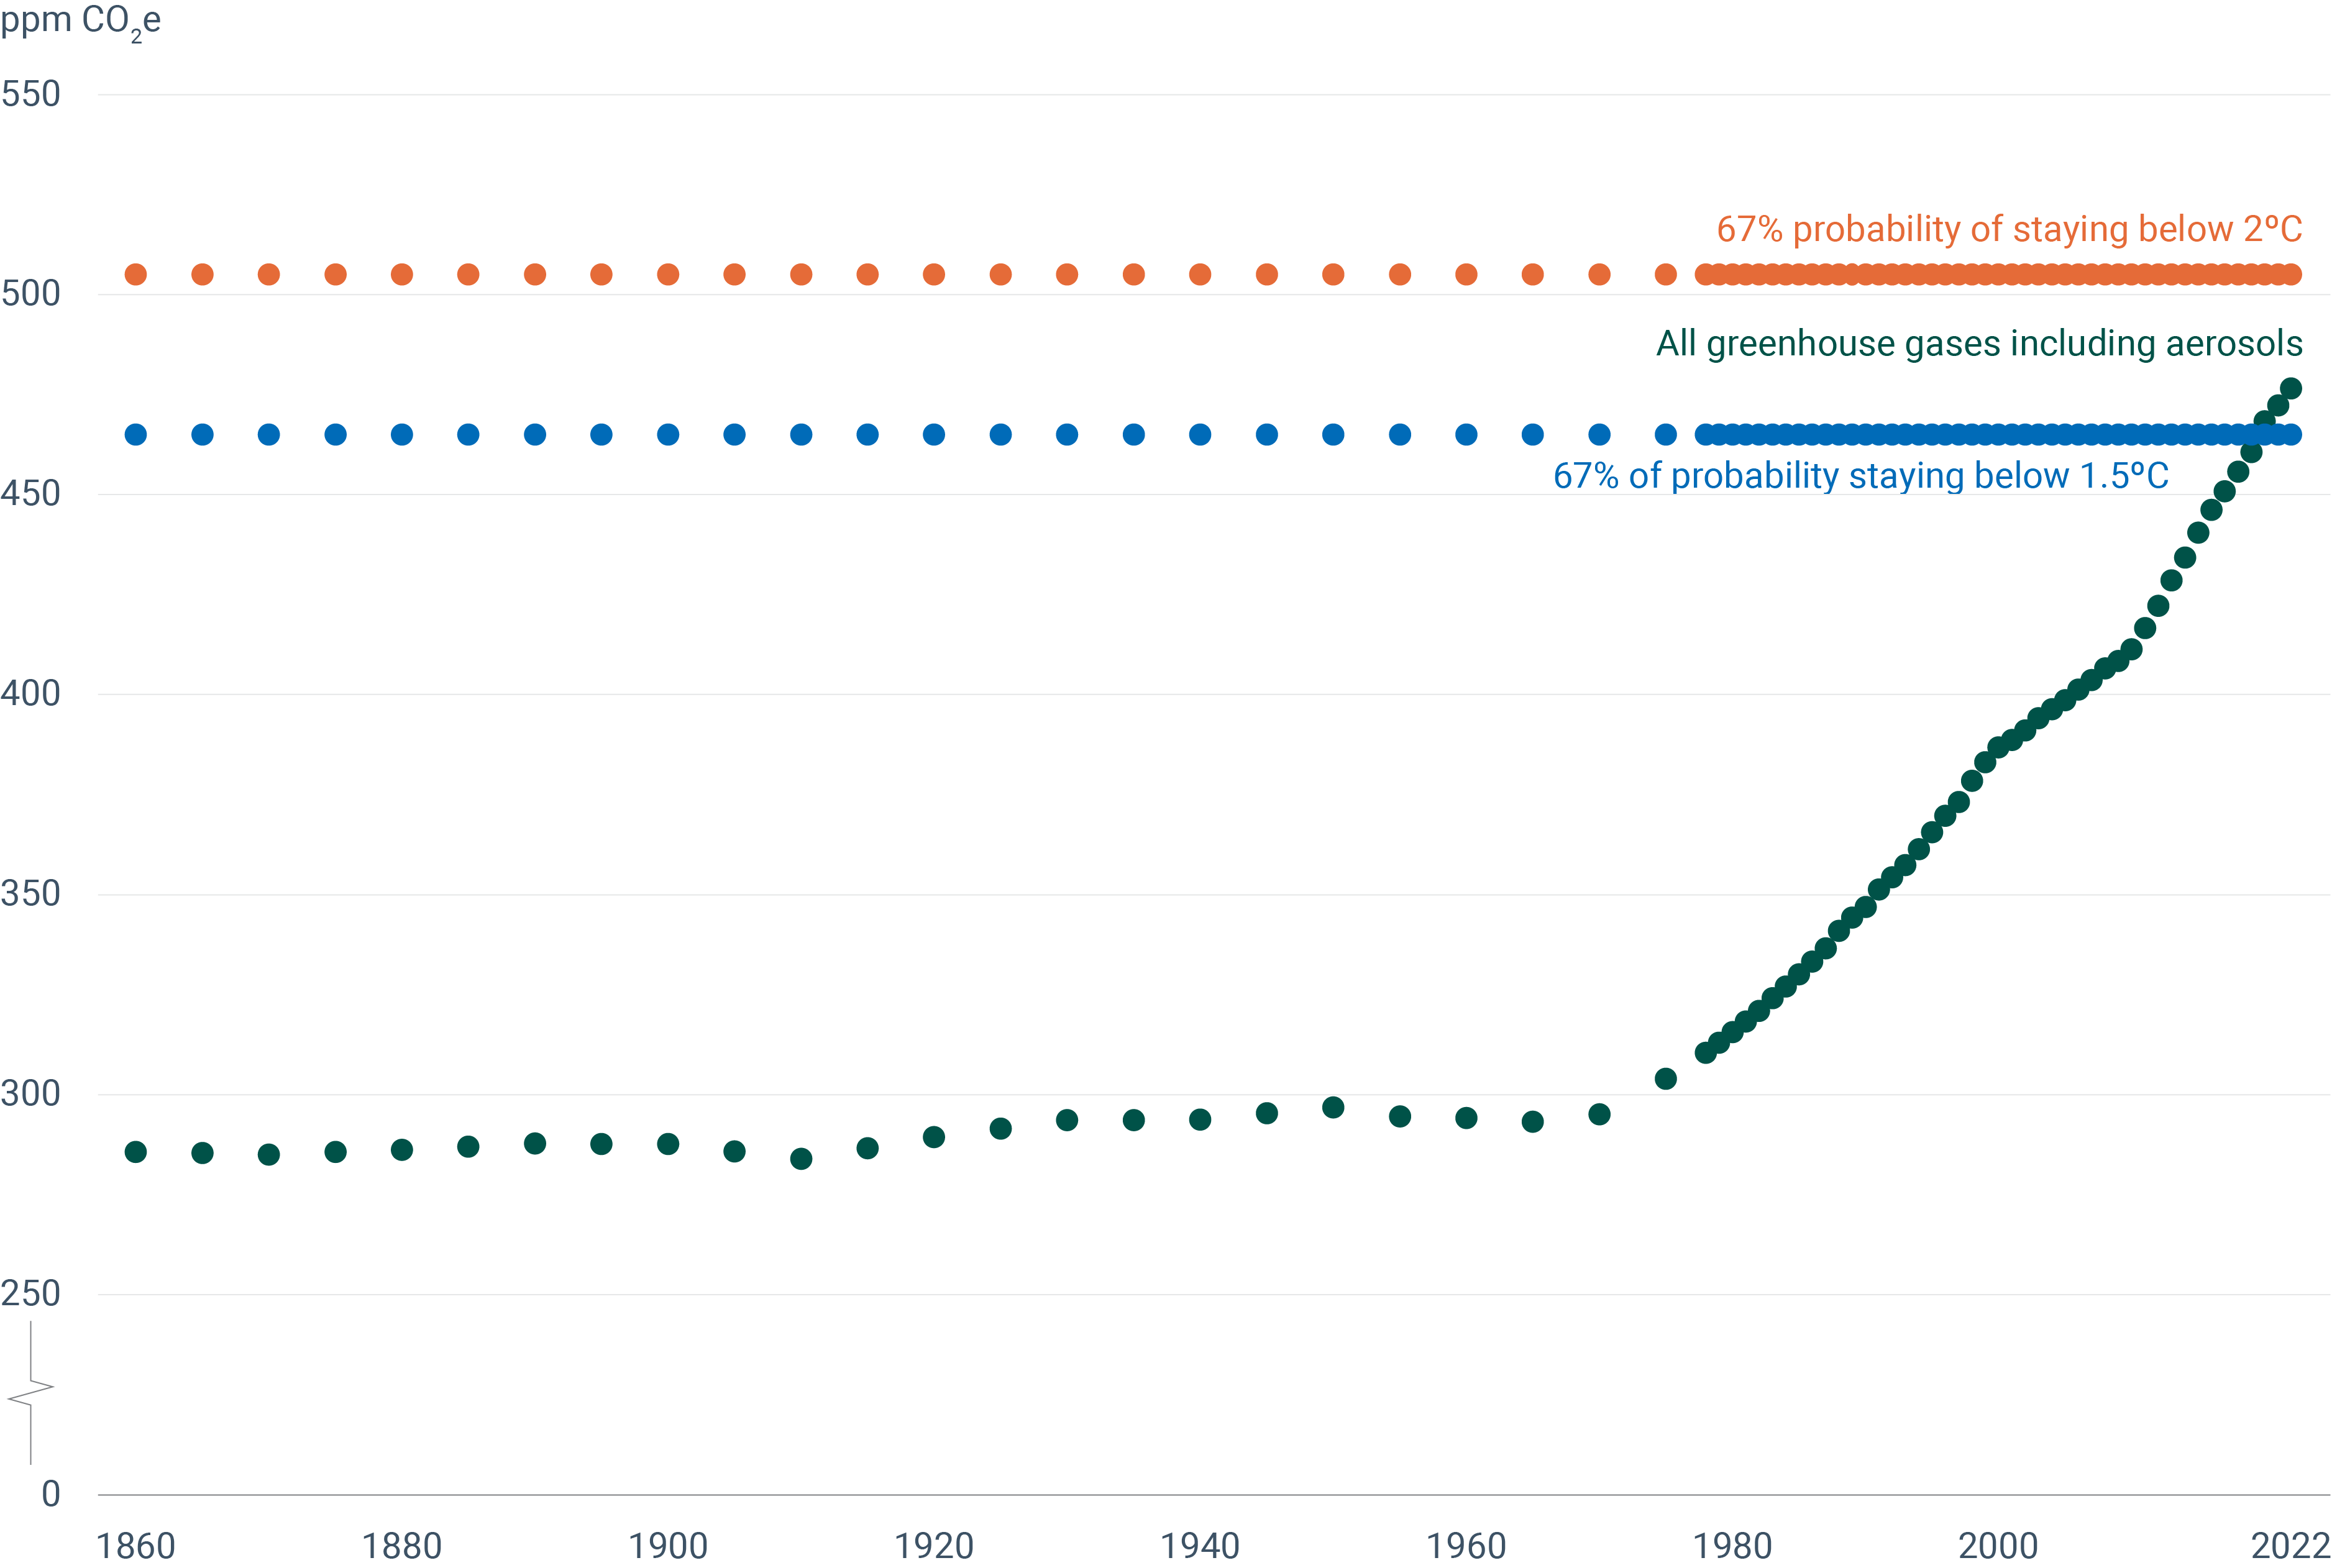
Figure 1. Observed trends in total greenhouse gas concentration levels between 1860 and 2022, considering all greenhouse gases and other forcing agents (including aerosols)
This indicator assesses the combined global atmospheric concentration of all greenhouse gases (GHGs) and forcing agents. It also evaluates how the status of and trend in that concentration relates to scientific knowledge and policy ambitions for limiting global temperature increase at the end of the century. The objective of the 2015 Paris Climate Agreement is ‘to hold the increase in the global average temperature to well below 2°C above pre-industrial levels and to pursue efforts to limit the temperature increase to 1.5°C above pre-industrial levels’.
An outcome of the Agreement following meetngs in Glasgow (2021), Sharm el-Sheikh (2022) and Dubai (2023) has been to ‘pursue efforts to limit the temperature increase to 1.5oC’. Here, it is important to consider all gases and other forcing agents using the so-called ‘CO2 equivalent’ (CO2e); (see supporting information). Note that some gases, such as sulphate aerosols, have a negative forcing (i.e. a cooling effect).
Considering all GHGs and other forcing agents (including aerosols), the total CO2e concentration reached 477ppm in 2022. This amount is about 4.5ppm more than last year, 48ppm more than 10 years ago (Figure 1), and about 196ppm more than in pre-industrial times. Similar to 2021, the annual increase in 2022 was relatively low. Assessing the contribution of the various groups of GHGs has shown that the greatest forcing by far is caused by gases covered by the Kyoto Protocol (KPGs).
The annual average concentration of CO2 reached 417ppm and 419ppm in 2022 and 2023, respectively (+139ppm or +150%) above pre-industrial levels. The average concentration of CH4 reached 1,907ppb in 2022 (plus 1,173ppb) and N2O reached 336 ppb (plus 64ppb). Combined, the gases covered by the Montreal Protocol (MPGs) contributed about 31ppm to climate forcing in 2022.
The non-protocol gases (NPGs) have a net cooling effect overall. In 2022, this effect amounted to about 50ppm CO2e, and as such, compensated for about 21% of the forcing induced by other GHGs. Note that the forcing (cooling) trend of NPGs is decreasing since 2010, especially due to lower concentration of sulphur dioxide. Further reading is available here.
Figure 2. Peak and 2100 concentrations of total GHGs in the atmosphere consistent with a 67% probability of keeping the average global temperature increase below targets
Pathways developed by the IPCC show concentrations of atmospheric GHGs in relation to specific temperature increases. These pathways show (1) peak concentrations that should not be exceeded to ensure that (2) CO2e concentrations in 2100 remain compatible with limiting the temperature increase to 1.5°C or 2°C above pre-industrial levels.
According to the IPCC’s most precautionary peak and 2100 concentration levels (those corresponding to a 67% chance of staying below target values without allowing a temperature overshoot in that period), global GHGs concentrations most not exceed 465 (range 445-485) ppm CO2e. They should return to 411 (390-430) ppm by 2100 to limit the increase to 1.5°C. For the 2°C limit, the corresponding values are 505 (470-540) ppm and 480 (460-500) ppm CO2e, respectively.
As such, the concentration in 2022 of 477ppm CO2e is near the upper limit of the mentioned range of (most-precautional) peak concentration that should not be exceeded to limit the global temperature increase to 1.5°C above pre-industrial times (445-485ppm CO2e) (figure 2).
When allowing a temporary temperature overshoot and considering the present decadal growth rate, the peak concentration threshold could be exceeded at maximum around 2028. There are few years left to stabilise the concentration, but concentrations must reduce further afterwards. In the case of the 2°C limit, the peak concentration will be reached around 2028-2031 (depending on a temperature overshoot).
Supporting information
The indicator shows the observed trends in greenhouse gas concentration levels. Greenhouse gases differ in the way they affect the climate system. In order to sum the effects of the individual greenhouse gases and other forcing agents in the atmosphere, the so-called ‘greenhouse gas equivalent concentration’ has been defined. This is the concentration of CO2 that would cause the same amount of radiative forcing as a mixture of CO2 and other forcing agents (greenhouse gases and aerosols).
Methodology for indicator calculation
The trend is based on combining data for numerous gases that affect the radiation balance on earth:
Greenhouse gases included in the Kyoto Climate Protocol: carbon dioxide (CO2), methane (CH4), nitrous oxide (N2O), and three groups of fluorinated gases (HFCs, PFCs, SF6)
Gases under the Montreal Protocol on ‘Substances that deplete the ozone layer’ CFCs, HCFCs, CH3Cl’s, CH3Br’s and halons
Other forcing agents and greenhouse gases that are not included in global treaties are dealt with at a regional level (e.g. UNECE Convention on Long Range Transboundary Air Pollution). This includes aerosols (sulphate, black carbon, organic carbon, nitrate, mineral dust, land-use related), tropospheric and stratospheric ozone (O3), stratospheric water vapour and aircraft contrails. Both the direct forcing effect of these agents and the indirect effect through aerosol-cloud interaction are included.
The trends in global average concentration levels of atmospheric CO2 for the period from 1950 are based on data available from the NOAA observatory, while more historic data are derived from Etheridge et al. Trend data for CH4, N2O, the fluorinated gases and other compounds under the Montreal Protocol were derived from station data that are available in the AGAGE data set. The global figures were derived by averaging the data from different observatory stations across the world, equally distributed over the northern and southern hemisphere. Pre-observational data for CO2, CH4 and N2O are based on ice core data. Pre-observational data for F-gases are the result of modeling. Data for the non-protocol agents are taken from IPCC and Myhre et al.
Radiative forcings are calculated using an approximate equation according to IPCC (2021), based on the observed atmospheric concentrations and using radiative efficiencies for CO2, CH4, and N2O, O3 (both stratospheric and tropospheric) and vapour based on IPCC (2021). IPCC (2021) and Myhre et al estimates were used for the radiative forcing of non-protocol related compounds. IPCC (2021) is also used to estimate the forcing of these compounds in more recent years, based on model projection.
The equations used to compute contributions by the individual gases are presented below:
Trace gas
Parameterisation, radiative forcing (RF), in Wm-2
(see also IPCC, 2021)
Constants
(IPCC, 2021)
CO2
change in RF = (alphaCO2+alphaN2O) ln (C/C0)
where
alphaCO2 = d1+a1(C-C0)2 + b1(C- C0)
alphaN2O = c1 (sq. root of N)
C and C0 are the current and pre-industrial concentrations (ppm) of CO2, respectively, N is the current N2O concentration (ppb)
𝑎1 = −2.4785 × 10⁻⁷ W m–2 ppm–2
𝑏1 = 7.5906 × 10⁻⁴ W m–2 ppm–1
𝑑1 = 5.2488 W m–2
𝑐1 = −2.1492 × 10⁻³ W m–2 ppb–1/2
CH4
change in RF = (a3 (sq.root of M) + b3 (sq.root of N)+d3) . ((sq. root of M) – (sq. root of M0))
M and M0 are the current and pre-industrial concentrations (ppb) of CH4, respectively; N is are the current concentration (ppb) of N2O.
𝑎3 = −8.9603 × 10⁻⁵ W m–2 ppb–1
𝑏3 = −1.2462 × 10⁻⁴ W m–2 ppb–1
𝑑3 = 0.045194 W m–2 ppb–1/2
𝑀0 = 731.41 ppb
N2O
change in RF = (a2 (sq.root of C) + b2 (sq.root of M) + c2 (sq.root of M) + d2) (sq. root of N - sq. root of N0 )
C is the current concentration (ppm) of CO2, M and M0 are the current and pre-industrial concentrations (ppb) of CH4, respectively; N and N0 are the current and pre-industrial concentrations (ppb) of N2O, respectively.
𝑎2 = −3.4197 × 10⁻⁴ W m–2 ppm–1
𝑏2 = 2.5455 × 10⁻⁴ W m–2 ppb–1
𝑐2 = −2.4357 × 10⁻⁴ W m–2 ppb–1
𝑑2 = 0.12173 W m-2 ppb–1/2
𝑁0 = 273.87 ppb
HFC, PFC & SF6
change in F = alpha (X-X0)
X and X0 are the current and pre-industrial concentrations (ppb) of gas X, respectively.
Values for alpha depending on molecule (see below),.
A similar approach was applied for the Montreal Protocol gases (i.e. CFCs & HCFCs):
CFCs & HCFCs
change in F = alpha (X-X0) X and X0 are the current and pre-industrial concentrations (ppb) of gas X, respectively.
Values for alpha depending on molecule (see below), taken from IPCC, 2021.
Table A1 Overview of alpha values used for Kyoto and Montreal Protocol Gases (see IPCC,2021)
Kyoto Protocol gases
Montreal Protocol gases
HFC-23
0.191
CFC-11
0.259
HFC-134a
0.167
CFC-12
0.32
HFC-32
0.111
CFC-13
0.278
HFC-125
0.234
CFC-113
0.301
HFC-143a
0.168
CFC-114
0.314
HFC152a
0.102
CFC-115
0.246
HFC-227ea
0.273
HCFC-22
0.214
HFC-136fa
0.251
HCFC-124
0.207
HFC-245fa
0.251
HCFC-141
0.161
HFC365mf
0.228
HCFC-142
0.193
CF4
0.099
CCl4
0.166
C2F6
0.261
CH3Cl
0.005
SF6
0.567
CHCl3
0.074
SF5CF3
0.585
CHCCl3
0.065
NF3
0.204
CH3Br
0.004
PCF-318
0.314
H1211
0.3
PCF-218
0.314
H1301
0.299
H2402
0.312
To quantify the total concentration of all greenhouse gases, the direct and indirect effect of multiple aerosols (sulphate, black carbon, organic carbon, nitrate, and mineral dust), and the forcing of tropospheric ozone, stratospheric water vapour, changes in albedo (e.g. due to black carbon) were added. Data on forcing have been based on IPCC,2021.
Also new data and information has been used to compute the forcing of aerosols and other agents (based on figures in the 2021 IPCC report and underlying literature like Meinshausen et al., 2020) (see Table A2). Firstly, the direct radiative (RFari) and indirect forcing of aerosols thought the cloud interaction (RFaci) and tropospheric ozone forcing has been derived from 1850 to 2019 (see Annex III, IPCC 2021). Then we summed the forcing of remaining gasses (e.g. stratospheric water vapour, aircraft contrails) and processes (esp. land use) to define the total of non-protocol gasses. Note that this forcing is stronger (more negative) than reported in earlier literature (e.g. IPCC, 2013) mainly due to the stronger signal of the indirect cloud effect.
Table A2 Calculated direct radiative forcing for multiple aerosols and tropospheric ozone for a number of past years (W/m2)
Gas (group)
2022
2020
2010
1990
1950
1900
1850
Direct aerosol-radiation
-0.20
-0.22
-0.27
-0.38
-0.15
-0.06
-0.01
Indirect aerosol-cloud interaction
-0.81
-0.83
-0.99
-1.05
-0.55
-0.29
-0.07
Indirect Black carbon on snow
-0.08
0.08
0.08
0.07
0.03
0.02
0.01
Ozone
0.47
0.47
0.44
0.36
0.17
0.08
0.03
Others
-0.09
-0.09
-0.11
-0.12
-0.12
-0.07
-0.03
Total
-0.54
-0.58
-0.85
-1.12
-0.62
-0.32
-0.07
Source: Based on IPCC, 2021 Annex III
Methodology for gap filling
If measurement data from a particular station are missing for a certain year, the global trend is derived from data available from other stations.
The overall objective of the United Nations Framework Convention on Climate Change (UNFCCC), is ‘to stabilize atmospheric greenhouse gas concentrations at a level that would prevent dangerous anthropogenic interference with the climate system’. Both at the global level and the EU level (October 2008 Environment Council conclusions), this ‘dangerous anthropogenic interference’ has been recognised by formulating an ambition of keeping the long-term global average temperature rise below 2°C, compared to pre-industrial levels. In December 2015, the Paris Agreement strengthened this by stating its objective as ‘holding the increase in the global average temperature to well below 2°C above pre-industrial levels and to pursue efforts to limit the temperature increase to 1.5°C above pre-industrial levels’. The agreements made at the COP in Glasgow (2021), Sharm el-Sheikh (2022) and Dubai (2023) even stated to “drive efforts to limit the temperature increase to 1.5°C".
Targets
No targets have been specified
Methodology uncertainty
Global average concentrations since approximately 1980, are determined by averaging measurements from several ground-station networks (SIO, NOAA/CMDL, ALE/GAGE/AGAGE), with each network consisting of several stations distributed across the globe.
Absolute accuracies of global average annual concentrations are around 1% for CO2, CH4, N2O and CFCs; for HFCs, PFCs, and SF6, absolute accuracies are between 10% and 20%. The largest uncertainties have been determined for the concentration of different aerosols such as sulphur, and black and organic carbon. The uncertainty in the trend of these aerosols could be 50-60%.
Radiative forcing is calculated using parameterisations that relate the measured concentrations of greenhouse gases to radiative forcing. The overall uncertainty in radiative forcing calculations is shown in the tables below (given in 10% and 90% confidence ranges), based on ranges in IPCC, 2021.
Table A3: Best estimate ERF values from average 1750-1850 to 2022(and 5% and 95% confidence ranges)(source for uncertainty ranges: IPCC, 2021, annex III.3) (in W/m2)
Group
Forcers
Best estimate
5%
95%
Kyoto Protocol
CO2
2.17
1.91
2.42
CH4
0.65
0.52
0.78
N2O
0.21
0.18
0.24
HFC, PFCs, SF6
0.07
0.05
0.08
Montreal Protocol
Montreal F gases
0.32
0.26
0.39
Non-Protocol
Tropospheric O3
0.47
0.24
0.71
Aerosols direct radiation effect
-0.20
-0.43
0.04
Aerosols indirect cloud interaction
-0.81
-1.39
-0.24
Stratospheric Vapour
0.05
0.00
0.10
Land use
-0.20
-0.30
-0.10
BC on snow
0.08
0.00
0.18
Air contrails
0.06
0.02
0.10
Total
2.87
2.07
3.67
(source: IPCC, 2021)
Data sets uncertainty
Uncertainty in relation to peak concentration values
The IPCC has modelled concentration levels of all greenhouse gases in the atmosphere, which are consistent with keeping the global average temperature increase below 1.5 and 2°C, for various probability levels (67%, 50% and 37% staying below). This indicator assessment uses those peak concentrations and 2100 concentration values of greenhouse gases in the atmosphere that, according to the IPCC (2018,2021), give a likely (67%) probability of staying below a 1.5°C and a 2°C temperature increase by the end of the century. This means that the concentration could peak somewhere between 2020 and 2100, and then become (strongly) reduced again (e.g. through zero emissions and even negative emissions though active CO2 removal). The IPCCalso introduced the temperature overshoot feature, which means that temperature targets may become temporarily exceeded, followed by a stronger decrease later in the century. Risking such a temperature overshoot would put an additional burden on strong reduction on GHGs emissions and even towards negative emissions reductions. These values and other probability values are presented below to indicate the uncertainty and variation in peak and 2100 concentration values.
Peak and 2100 concentration levels of total greenhouse gases in the atmosphere consistent with keeping the global average temperature increase below 1.5°C and 2°C, for various probability levels. The ranges are given in brackets (all based on IPCC).
Probability of staying below target
Temperature overshoot
1.5°C target
2.0°C target
Peak concentration
Concentration 2100
Peak concentration
Concentration 2100
>67% (likely)
No
465
(445-485)
411
(390-430)
505
(470-540)
480
(460-500)
Yes
485
(465-505)
405
(385-425)
520
(505-540)
465
(440-480)
50% (about as likely as not)
(33%-67%)
No
485
(465-500)
440
(430-445)
540
(510-560)
520
(500-535)
Yes
525
(520-540)
425
(410-435)
560
(540-575)
505
(480-530)
<33% (unlikely)
No
500
(480-530)
470
(445-480)
580
(550-615)
570
(540-600)
Yes
535
(510-550)
450
(425-460)
600
(560-630)
540
(505-580)
Rationale uncertainty
No uncertainty has been specified.
Peak and 2100 concentration levels of total greenhouse gasses in the atmosphere (dataset URL not available), Netherlands Environmental Assessment Agency (PBL)
<div class="csl-bib-body" style="line-height: 1.35; ">
<div class="csl-entry">Masson-Delmotte, V., Zhai, P., Pirani, A., Connors, S. L., Péan, C., Berger, S., Caud, N., Chen, Y., Goldfarb, L., Gomis, M. I., Huang, M., Leitzell, K., Lonnoy, E., Matthews, J. B. R., Maycock, T. K., Waterfield, T., Yelekçi, Ö., Yu, R. and Zhou, B., eds., 2021, <i>Climate Change 2021: The Physical Science Basis. Contribution of Working Group I to the Sixth Assessment Report of the Intergovernmental Panel on Climate Change</i>, Cambridge University Press.</div>
</div>
<div class="csl-bib-body" style="line-height: 1.35; ">
<div class="csl-entry">Etheridge, D. M. et al., 1998, 'Atmospheric methane between 1000 A.D. and present: evidence of anthropogenic emissions and climatic variability', <i>Journal of Geophysical Research</i> 103, pp. 15979–15993 (
<a key=link-1 href=https://agupubs.onlinelibrary.wiley.com/doi/abs/10.1029/98JD00923 rel="noopener">
https://agupubs.onlinelibrary.wiley.com/doi/abs/10.1029/98JD00923
</a>) accessed October 7, 2021.</div>
</div>
<div class="csl-bib-body" style="line-height: 1.35; ">
<div class="csl-entry">Etheridge, D. M. et al., 2002, 'Historical CH4 records since about 1000 A.D. from ice core data', in: <i>In Trends: A Compendium of Data on Global Change</i>, Carbon Dioxide Information Analysis Center, Oak Ridge National Laboratory, U.S. Department of Energy, Oak Ridge, Tenn., U.S.A.</div>
</div>
<div class="csl-bib-body" style="line-height: 1.35; ">
<div class="csl-entry">Machida, T. et al., 1995, 'Increase in the atmospheric nitrous oxide concentration during the last 250 years', <i>Geophysical Research Letters</i> 22, pp. 2921–2924 (
<a key=link-1 href=https://agupubs.onlinelibrary.wiley.com/doi/abs/10.1029/95GL02822 rel="noopener">
https://agupubs.onlinelibrary.wiley.com/doi/abs/10.1029/95GL02822
</a>) accessed October 7, 2021.</div>
</div>
<div class="csl-bib-body" style="line-height: 1.35; ">
<div class="csl-entry">Myhre, G., Aas, W., Cherian, R., Collins, W., Faluvegi, G., Flanner, M., Forster, P., Hodnebrog, Ø., Klimont, Z., Lund, M. T., Mülmenstädt, J., Lund Myhre, C., Olivié, D., Prather, M., Quaas, J., Samset, B. H., Schnell, J. L., Schulz, M., Shindell, D. et al., 2017, 'Multi-model simulations of aerosol and ozone radiative forcing due to anthropogenic emission changes during the period 1990&ndash;2015', <i>Atmospheric Chemistry and Physics</i> 17(4), pp. 2709–2720 (
<a key=link-1 href=https://acp.copernicus.org/articles/17/2709/2017/ rel="noopener">
https://acp.copernicus.org/articles/17/2709/2017/
</a>) accessed December 16, 2021.</div>
</div>
<div class="csl-bib-body" style="line-height: 1.35; ">
<div class="csl-entry">Meinshausen, M., Nicholls, Z. R. J., Lewis, J., Gidden, M. J., Vogel, E., Freund, M., Beyerle, U., Gessner, C., Nauels, A., Bauer, N., Canadell, J. G., Daniel, J. S., John, A., Krummel, P. B., Luderer, G., Meinshausen, N., Montzka, S. A., Rayner, P. J., Reimann, S. et al., 2020, 'The shared socio-economic pathway (SSP) greenhouse gas concentrations and their extensions to 2500', <i>Geoscientific Model Development</i> 13(8), pp. 3571–3605 (
<a key=link-1 href=https://gmd.copernicus.org/articles/13/3571/2020/ rel="noopener">
https://gmd.copernicus.org/articles/13/3571/2020/
</a>) accessed December 9, 2022.</div>
</div>
<div class="csl-bib-body" style="line-height: 1.35; ">
<div class="csl-entry">IPCC, 2013, <i>Climate change 2013 — the physical science basis: contribution of Working Group I to the Fifth Assessment Report of the Intergovernmental Panel on Climate Change</i>, Cambridge University Press, Cambridge.</div>
</div>
<div class="csl-bib-body" style="line-height: 1.35; ">
<div class="csl-entry">UNFCCC, 2009, 'Report of the Conference of the Parties on its fifteenth session, held in Copenhagen from 7 to 19 December 2009. Addendum. Part Two: Action taken by the Conference of the Parties at its fifteenth session. | UNFCCC', (
<a key=link-1 href=https://unfccc.int/documents/6103 rel="noopener">
https://unfccc.int/documents/6103
</a>) accessed December 16, 2021.</div>
</div>