The World Health Organization (WHO) has established air quality guidelines (AQG), or recommendations for maximum concentrations to protect human health from the impacts of air pollutants. These values are based on scientific evidence. The EU´s Ambient Air Quality Directives set maximum values (limit and target) for the concentration levels for a total of 13 air pollutants. Although these values are based on the WHO AQG, they also take into account the technical and economic feasibility of their attainment across EU Member States. For most air pollutants, the EU air quality standards are less strict than the WHO AQG.
Source: CSI004
When the maximum EU limit or target values are exceeded, the relevant authorities (such as a city council) must implement air quality plans and measures to reduce levels of air pollutants as quickly as possible. Air quality plans and measures may also be implemented in cases where air quality is good, either to maintain healthy levels or to improve them.
This analysis highlights those pollutants deemed to be most harmful to human health and the environment or that exceed the maximum EU air quality standards and WHO guideline levels most frequently. The data were extracted from the EEA’s reporting system on 27 April 2021.
The analysis of 2019 validated data includes maps and boxplots, while the analysis of provisional 2020 up-to-date (UTD) data includes only maps. 2020 validated data will be available later this year and presented in the 2022 air quality report.
The lists of countries that submitted data for 2019 and for 2020, additional information and further analysis can be found in the Eionet status reports ETC/ATNI 2021/7 and ETC/ATNI 2021/8, prepared by the European Topic Centre on Air Pollution, Transport, Noise and Industrial Pollution.
Navigate the tabs for information on each pollutant:
- PM10
- PM2.5
- Ozone
- NO2
- BaP
- Other pollutants
PM10 are particulate matter with a diameter of 10 µm or less. They are emitted mainly by the combustion of fuels for domestic heating, while industrial activities, agriculture and road transport are also important sources. Some come also from natural sources such as sea salt or Saharan dust and, finally, some are formed in the atmosphere from the combination of different gases.
Although exceedances of the EU daily limit value are widespread across the continent, the highest concentrations were found in some countries in central and eastern Europe and in northern Italy. In most countries of central and eastern Europe, solid fuels such as coal are widely used for heating households and in some industrial facilities and power plants. The Po Valley, in northern Italy, is a densely populated and industrialised area with specific meteorological conditions that favour the accumulation of air pollutants in the atmosphere.
Concentrations of PM10 in 2019:
- 21 reporting countries, of which 16 were EU Member States, registered concentrations above the EU daily limit value
- 11 reporting countries, of which 7 were EU Member States, registered concentrations above the EU annual limit value of 40 µg/m3
- 31 reporting countries registered concentrations above the stricter WHO guideline, the exceptions being Estonia, Finland, Iceland, Ireland, Luxembourg and Switzerland
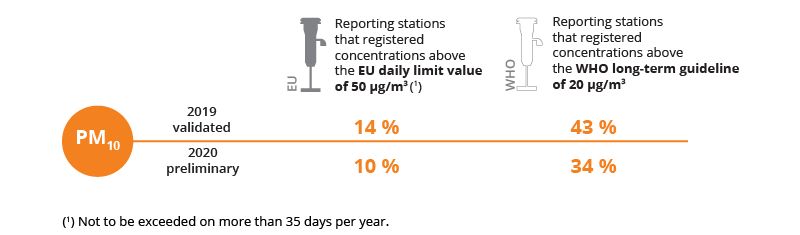
Concentrations above the EU daily limit value were measured at 14 % of reporting stations, 87 % of which were urban and 10 % suburban.
Concentrations of PM10 in 2020:
- 10 reporting countries, of which 8 were EU Member States, reported concentrations above the daily limit value
- 4 reporting countries, of which 2 were EU Member States, reported concentrations above the annual limit value
- 21 reporting countries reported concentrations above the WHO AQG
PM2.5 are particulate matter with a diameter of 2.5 µm or less. They are emitted mainly by the combustion of fuels for domestic heating, industrial activities, and road transport. As with PM10, they can also come from natural sources and can be formed in the atmosphere. Agricultural emissions of ammonia make a significant contribution to the formation of particulate matter in the atmosphere.
The highest concentrations were found in central and eastern Europe and northern Italy. As for PM10, the use of solid fuels is the main reason for the situation in central and eastern Europe, together with an older vehicle fleet. In northern Italy, the high concentrations are due to the combination of a high density of anthropogenic emissions and meteorological conditions that favour the accumulation of air pollutants in the atmosphere.
Concentrations of PM2.5 in 2019:
- 7 reporting countries, of which 4 were EU Member States, registered concentrations above the EU annual limit value
- 28 reporting countries registered concentrations above the long-term WHO AQG
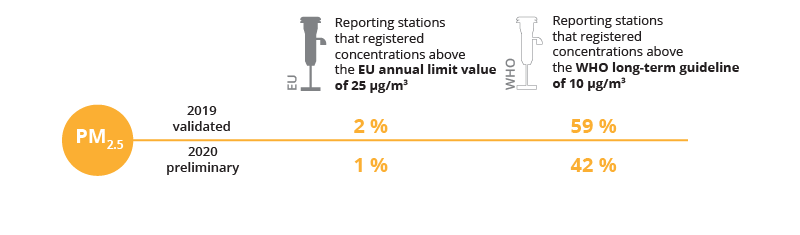
Concentrations of PM2.5 above the EU annual limit value were registered at 2 % of reporting stations, 77 % of which were urban and 13 % suburban. Concentrations above the WHO AQG for PM2.5 were registered across all reporting countries, except Albania, Estonia, Finland, Iceland, Luxembourg, Norway and Sweden.
Despite the generally decreasing levels of PM2.5, some Member States had not yet met the exposure concentration obligation that was set under the Ambient Air Quality Directive to be attained as of 2015.
Concentrations of PM2.5 in 2020:
- 4 reporting countries, of which 2 were EU Member States, registered concentrations above the EU annual limit value
- 19 reporting countries registered concentrations above the WHO AQG
Ozone (O3) is a pollutant formed in the atmosphere when heat and light cause chemical reactions between nitrogen oxides and volatile organic compounds (VOCs), including methane. Emissions of these gases are anthropogenic and, in the case of VOCs, also biogenic. Ozone also enters Europe from other parts of the northern hemisphere and from the upper atmosphere. Meteorology plays an important role in the formation and interannual variation of air pollutant concentrations, and this effect is especially significant for ozone.
Note: Data are presented here for 1 year only, not the average over a 3-year period as stated in the definition of the EU target value for O3.
The highest concentrations were found in southern parts of Europe during spring and summer, when the meteorological conditions favour ozone formation.
Concentrations of O3 in 2019:
- 24 reporting countries, of which 19 were EU Member States, registered levels above the EU target value for the protection of human health
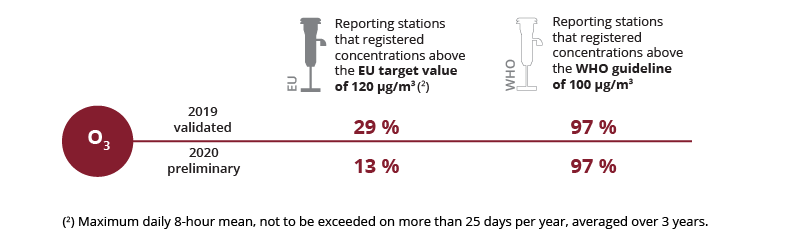
The long-term EU objective for ozone of 120 µg/m3 was met at only 12 % of monitoring stations in 2019, with all countries reporting stations with concentrations above the long-term objective.
Note: Data are presented here for 1 year only, not the average over a 3-year period as stated in the definition of the EU target value for O3
In both 2019 and 2020, all countries had stations with concentrations above the WHO AQG, with the WHO AQG for ozone exceeded at 97 % of reporting stations in both years.
Concentrations of O3 in 2020:
In 2020, the long-term EU objective for ozone was met at 18 % of stations. Andorra was the only country in which all reported concentrations were below the long-term objective.
The main source of nitrogen dioxide (NO2) is road transport, which emits NO2 close to the ground and mostly in densely populated areas, contributing to population exposure. Other important sources are combustion processes in industry and energy supply.
The highest concentrations were found across Europe in bigger cities with a high traffic volume. The impact of the COVID-19 related lockdown measures during the reporting period is clearly seen for this air pollutant, as its main source — road transport — was also one of the most reduced activities.
Concentrations of NO2 in 2019:
- 22 reporting countries, of which 18 were EU Member States, registered concentrations above the EU annual limit value, which for NO2 is the same as the WHO AGQ
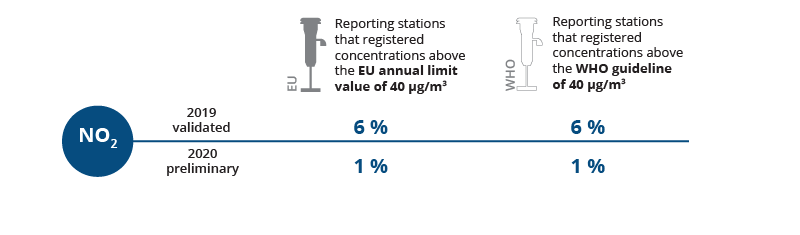
Concentrations of NO2 above the EU annual limit value were registered at 6 % of all reporting stations, 87 % of which were traffic stations.
Concentrations of NO2 in 2020
Concentrations of NO2 above the annual limit value (and the WHO AQG) were registered at 1 % of reporting stations, 89 % of which were traffic stations.
Benzo[a]pyrene (BaP) is a carcinogenic pollutant emitted mainly from the combustion of coal and wood and, to a lesser extent, from the combustion of agricultural waste.
The highest concentrations were found in central and eastern Europe, where the use of coal and other solid fuels for residential heating is widespread.
Concentrations of Benzo[a]pyrene in 2019:
Concentrations above 1.0 ng/mm3 were registered at 27 % of the stations, of which 94 % were urban (77 %) or suburban (17 %).
Concentrations of sulphur dioxide (SO2) in 2019:
In 2020 concentrations of SO2 above the EU daily limit value were registered in two countries. In the same year, concentrations above the daily WHO AQG were registered in 24 reporting countries, at 25 % of the reporting stations.
Concentrations above EU target/limit values, were registered in 2019 for the following:
-
Carbon monoxide (CO): in three out of 36 reporting countries
-
Benzene (C6H6): in two out of 31 reporting countries
-
Arsenic (As): in three out of 28 reporting countries
-
Cadmium (Cd): in one out of 28 reporting countries
-
Nickel (Ni): in three out of 28 reporting countries
-
Lead (Pb): in one out of 28 reporting countries
The apparent improvement in the situation in 2020, with lower concentrations of PM10, PM2.5 and NO2, is partly due to the lockdown measures implemented during the outbreak of the COVID-19 pandemic. These measures resulted in a reduction of many activities (such as road transport, aviation, shipping, some industries), while some others remained more or less unchanged (such as agriculture) or might have increased such as household energy consumption.
Where do the data come from?
The concentrations are obtained from measurements in monitoring stations that are officially reported to the EEA by its member countries. The classification of the monitoring stations and the criteria used to determine their inclusion in the analyses are described here. The countries that submitted data are summarised in Table 1 for 2019, and Table 2 for 2020.
The analysis for 2019 is based on validated data that are verified by the countries. The analysis for 2020 is based on provisional data reported in near-real time throughout the year. The analysis for 2020 is, therefore, provisional, and may change once the set of fully validated data is received by the EEA and more countries are considered.
Further information on the concentrations of air pollutants, including those for previous years, can be found at the EEA's statistics viewer. The data can also be downloaded here.
Note: The withdrawal of the United Kingdom from the European Union did not affect the production of this assessment. Data for the United Kingdom appear here in agreement with the terms of the Withdrawal Agreement, which entered into force on 1 February 2020. Data reported by the United Kingdom are included in all analyses and assessments contained herein, unless otherwise indicated.
Identifiers
Briefing no. 08/2021
Title: Europe’s air quality status 2021
HTML - TH-AM-21-008-EN-Q - ISBN 978-92-9480-385-6 - ISSN 2467-3196 - doi: 10.2800/30241


Document Actions
Share with others