Read here the report on the Circularity Metrics Lab for Plastics from the European Topic Centre on Circular Economy and Resource Use.
The need for more data and knowledge on circularity of plastics
Developing a circular economy is critical to making plastics more sustainable (EEA 2020b, 2023b) and is a central aim of the EU in its plastic strategy (EC, 2020) and recent legislation related to plastics. Furthermore, the United Nations Intergovernmental Negotiating Committee (INC) is developing an international, legally binding instrument to end plastic pollution, including in the marine environment. Here, data and knowledge on plastics, including their impacts and circularity, are crucial for the negotiations and any monitoring of the future agreement. Therefore, greater insight into plastics circularity and the challenges and opportunities it presents are essential.
Box 1. The plastics module of the EEA’s Circularity Metrics Lab (CML)
Evidence relating to the circular economy is fragmented or only partially covered through data and knowledge but is needed to assess the state of circularity. The CML complements other circularity monitoring frameworks by presenting ‘additional’ evidence on circularity.
The CML plastics module provides metrics that do not necessarily have the benefits of broad geographical coverage or long time series and provide room for more ‘experimental’ data sources.
A key purpose for CML plastics, and of this briefing, is to present a diverse group of metrics to reveal the status and trends for the circular plastics economy in Europe.
Link to EEA’s Circularity Metrics Lab (CML) thematic module on plastics
Levels of plastics production and consumption are high and expected to grow in the future
Plastics production and consumption
Over the past two decades, global plastics production and consumption rates have doubled. Between today and 2060, they are expected to triple (OECD, 2022). Thus, we are in a period of rapid increases in plastics production and consumption. We must pay attention to minimising the negative impacts to the environment and climate change that result from this.
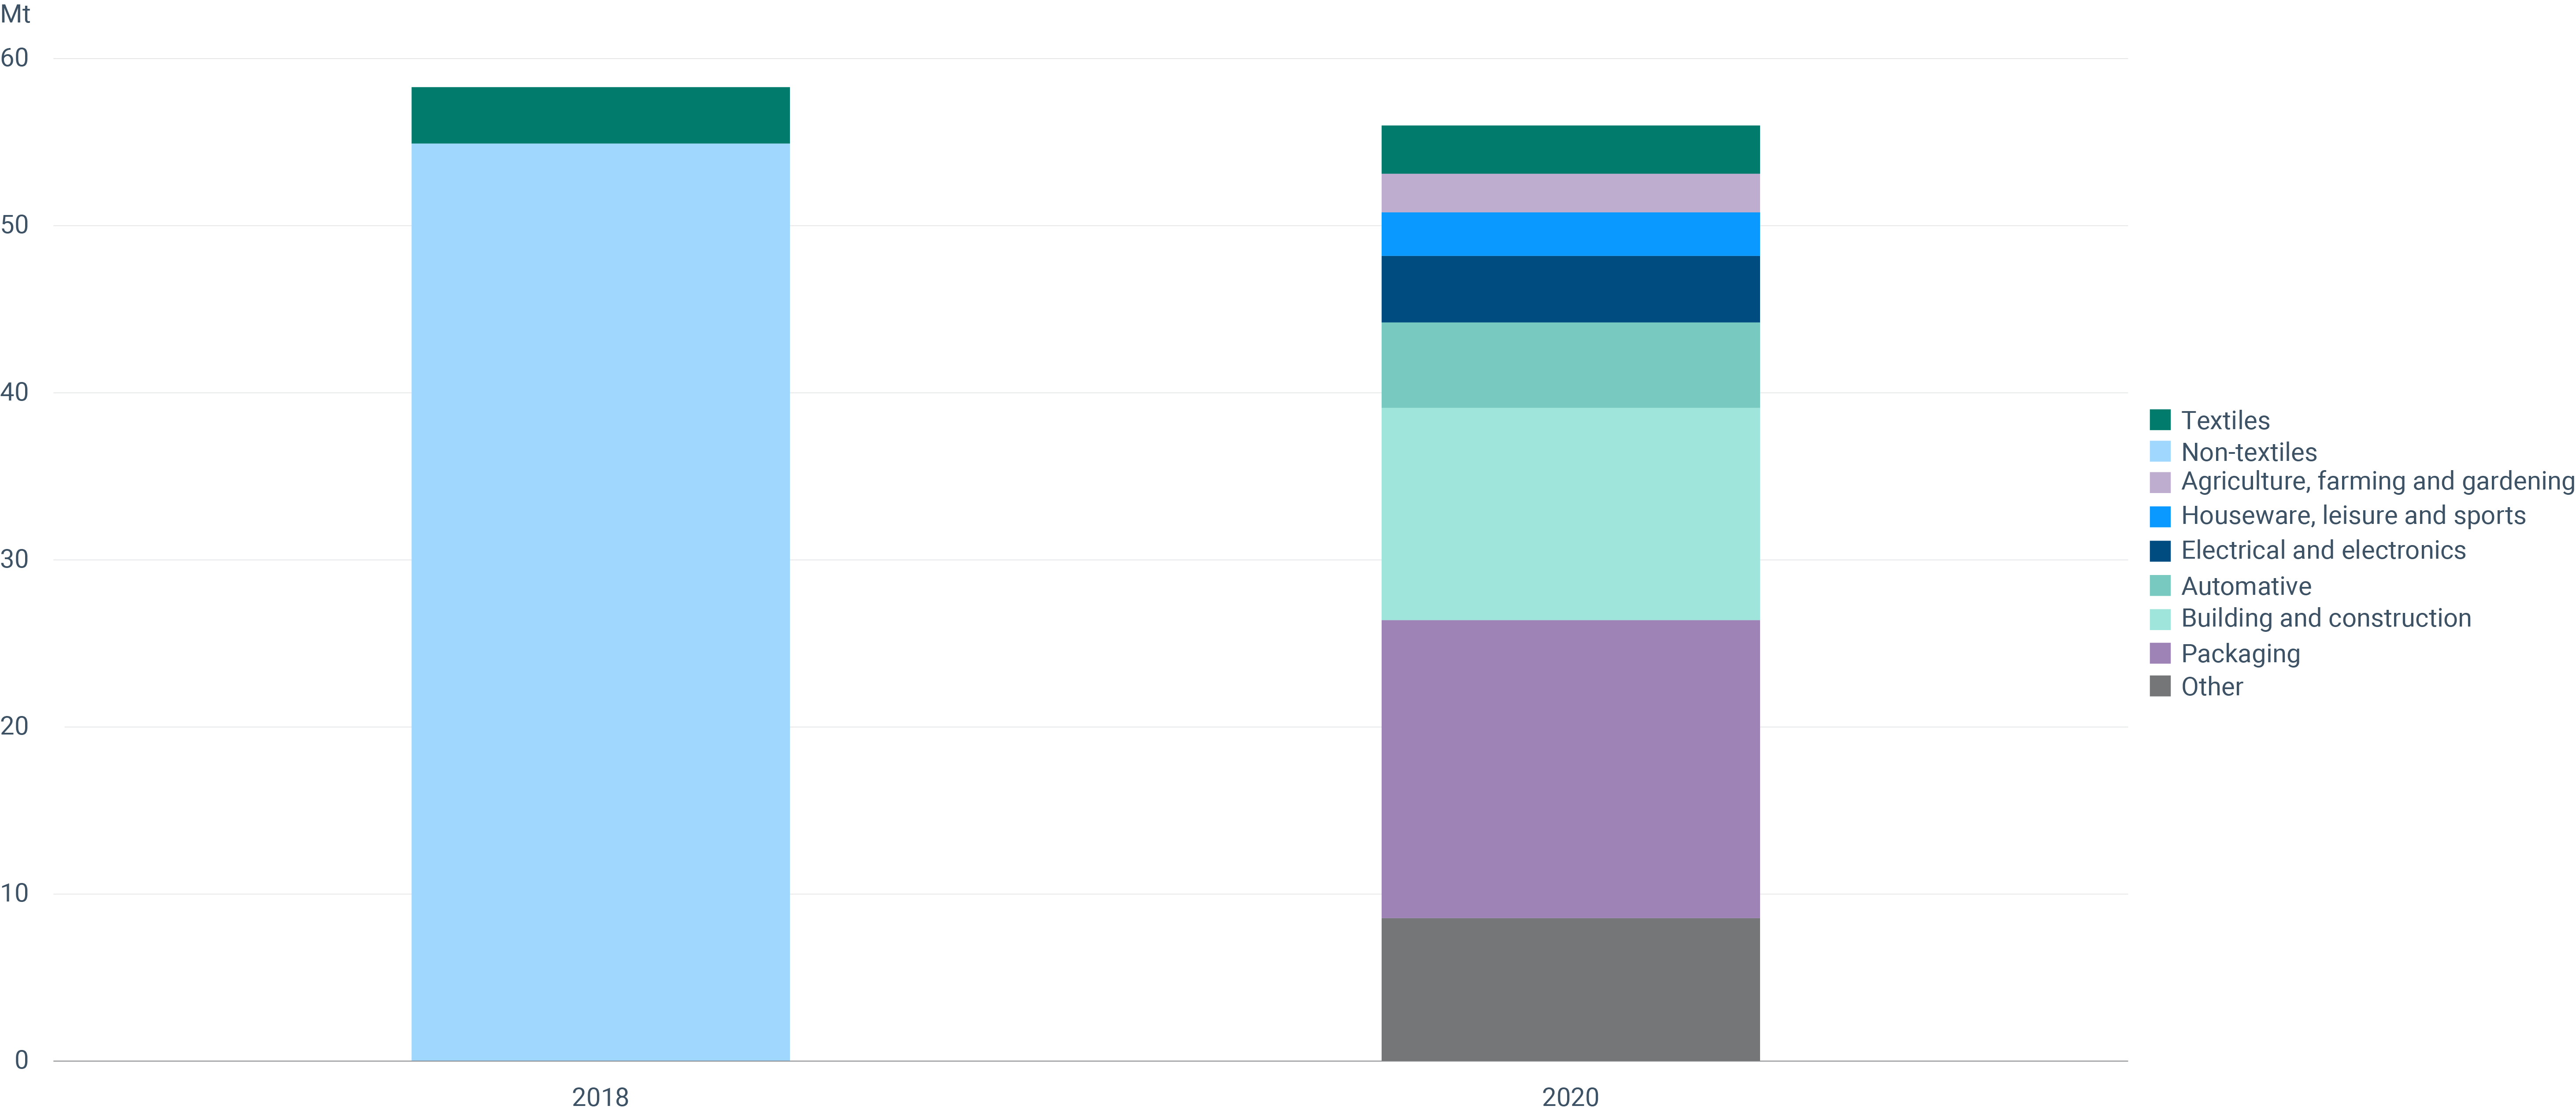
In Europe, plastics consumption by end-users showed a slight decrease from 58.8 million tonnes (Mt) in 2018 to 56.5Mt in 2020 (Figure 1). This volume equates to 107 kg/capita per year, making the EU one of the highest per capita consumers of plastics (OECD, 2022). The slight decrease in plastics consumption between 2018 and 2020 cannot be regarded as a continuing trend since it relates to the economic slowdown in Europe during the COVID-19 pandemic. EU plastics consumption is expected to double by 2060 – lower than the global average projected growth (OECD, 2022).
In 2020, the packaging sector and the building and construction sector consumed more than half of plastics in Europe, followed by: automotive; electrical and electronic appliances; houseware, leisure and sports; agriculture, farming and gardening; and the textiles sectors (Figure 1). Textiles are often absent from data on European plastics consumption.
Notes: Synthetic fibres and yarns are included under product groups 13.10 and 20.60 in the Prodcom database.
Sources: Authors’ compilation based on data from Plastics Europe, 2019, 2022b; Eurostat, 2024b (data for synthetic textiles).
Click here for different chart formats and data
Global bio-based plastics production
Bio-based plastics are produced from alternative feedstocks to fossil fuels, such as sugarcane, wood, or organic waste and its by-products. The benefits of bio-based plastics include the potential for lower climate impacts (in GHG emissions throughout their lifetime) and lower dependence on fossil fuels from outside Europe. However, this depends on the raw material and production process, which may lead to higher environmental impacts on land use, water use and biodiversity (EEA, 2020a).
Today, about 2.2Mt or 0.5% of plastics on the global market are bio-based, i.e. produced from a bio-based feedstock. The share of bio-based plastics in total plastics production is slowly increasing year by year (from 0.54% in 2013 to 0.56% in 2022) (European Bioplastics, 2023).
If current production trends prevail, bio-based plastics will continue to represent only a niche part of plastics production and consumption.
Plastics cause increasing harm to the environment and climate change
The growing production and consumption of plastics — worldwide and in Europe — is causing increasing environmental harm and impacting climate change. This includes marine litter, microplastics in the environment and GHGs from the plastics value chain.
Marine and beach litter
Marine litter is mismanaged waste in the sea. It is either discarded directly into the sea or reaches it from rivers, land or beaches by sewage, stormwater or winds. Sources of marine and beach litter can be either land-based or sea-based. Plastic items comprise the bulk of total litter on European beaches (ETC/ICM, 2022).
The threshold value for beach litter is less than 20 macro (see examples below) litter items per 100 metres of beach strip (Good Environmental Status). In 2022, this threshold was breached in three of four European seas (EEA, 2024b).
Compared with the North-East Atlantic Ocean and the Baltic Sea, the Mediterranean Sea and Black Sea are more littered (EEA, 2024b).
The overall trends of sea and beach litter show fluctuations between 2013 and 2022 (see Figure 2), indicating that reducing beach litter requires greater efforts.
Source: EEA, 2024b.
Click here for different chart formats and data
The top five item types found on European beaches in 2022 were all made of plastics. In decreasing order, these were:
- cigarette butts and filters (23.4%);
- plastic pieces 2.5-50 cm (9.5%);
- polystyrene pieces 2.5-50 cm (5.3%);
- other plastic/polystyrene items (identifiable) (4.6%); and
- plastic caps/lids drinks (3.9%) (EEA, 2023b).
Policies promoting the circularity of plastics, such as the Single-Use Plastics Directive (EU, 2019), are intended to reduce the amounts of plastic items on European beaches and in marine environments, among other things.
Microplastics pollution
Microplastics are bits of plastic which are less than 5mm in size. They are found everywhere from mountain tops to ocean floors, in the air and even in our bodies.
Once microplastics reach the environment, they are extremely difficult to remove, persistent and very mobile. Therefore, the accumulation of microplastics in the environment and our bodies is a serious and growing concern.
In 2019, the use of plastics in the EU was estimated to produce between 0.7Mt to 1.8Mt of unintentional release of microplastics into the environment (EC, 2023c). Unintended releases are caused by the ‘wear and tear’ of plastic products during the use stage (see Box 2).
In addition, there are releases from microplastics intentionally added to products, such as cosmetics and microplastics released from the breakdown of microplastic pollution items (also known as secondary microplastic pollution).
The European Commission has taken several steps to reduce pollution from microplastics, including a recent proposal toto prevent plastic pellet losses (EC, 2023c), the 2021 EU Action Plan: “Towards a Zero Pollution for Air, Water and Soil” sets a 2030 target to reduce plastic litter at sea (by 50%) and microplastics released into the environment (by 30%) (COM/2021/400 final), and under the EU chemical legislation REACH, measures have been adopted to restrict microplastics intentionally added to products (EC, 2023d).
With plastics production and consumption projected to increase, there will be a need for circular economy actions to help further reduce the release of microplastics through regulations, stricter design and performance standards, behavioural changes and other actions.
Box 2. Main sources of unintentionally released microplastics and their estimated annual amounts
Paints: between 231,000 to 863,000 tonnes — paint releases occur during application, wear and tear or removal. Approximately 21% of the 2.4Mt of plastic polymers used in paint in the EU in 2019 leaked into the environment in the form of microplastics.
Tyres: between 360,000 to 540,000 tonnes — Microplastic releases from tyres are generated as a consequence of the friction of tyres on road surfaces. Passenger cars make up the largest source of tyre wear particle emissions.
Pellets: between 52,140 to 184,290 tonnes — pellets are small pieces of raw material used to produce plastic products that can be lost during handling and transportation. Pellets are known to be eaten by a range of marine and coastal species and can cause physical harm or death.
Textiles: between 1,649 to 61,078 tonnes — approximately 60% of textiles are made from plastics. Small fibres are lost during the production, use, washing, drying and waste handling of textiles.
Source: EC, 2023c.
Greenhouse gas emissions from plastics
A key problem with plastics is their contribution to climate change. Over 99% of plastic is made from fossil fuels, and plastic products produce considerable GHG emissions across their life cycle (ETC/WMGE, 2021).
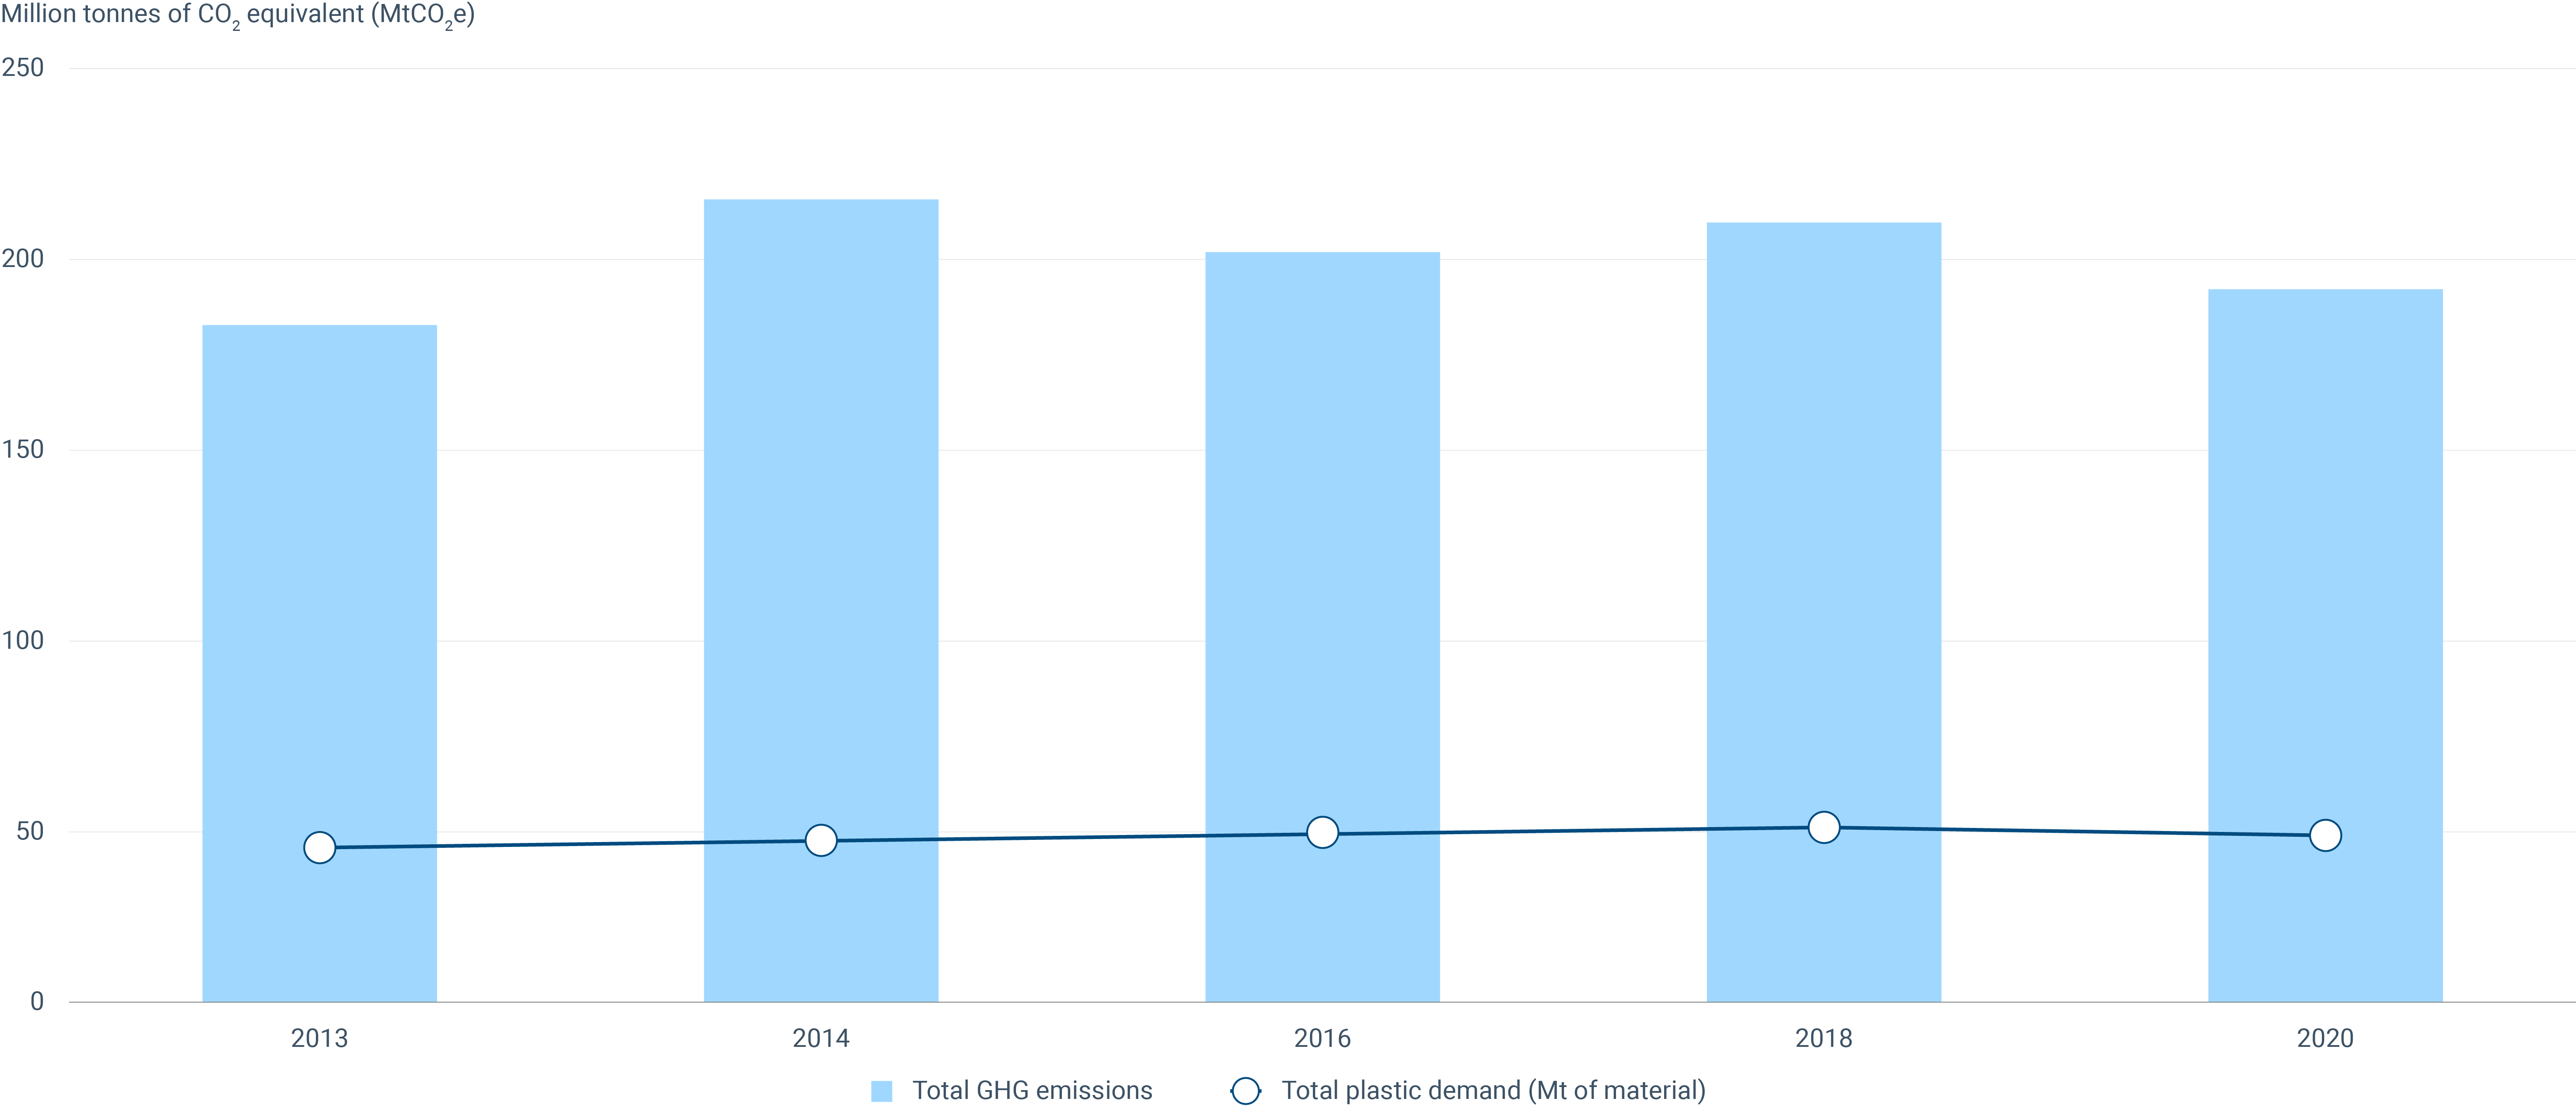
In 2020, the total GHG emissions from the EU’s plastics value chain were 191Mt of CO2 equivalent (MtCO2e) (ETC/WMGE, 2021), as illustrated in Figure 3. For comparison, Belgium’s total annual GHG emissions were 123MtCO2e in 2019. In 2018, the first year for which such data is available, 63% of GHG emissions in the EU plastics value chain were from plastics production. Converting polymers into products accounts for 22% and end-of-life plastic waste treatment adds another 15%, mainly due to incineration.
Notes: MtCO2e, Mt carbon dioxide equivalent.
Source: ETC/WMGE, 2021.
Click here for different chart formats and data
There was a slight decrease in emissions from 2018, when there were 208 MtCO2e compared to 191MtCO2e in 2020. This mirrors the overall decline in economic activities due to the COVID-19 pandemic. As such, the GHG emissions from plastics are expected to increase as the economy (and plastic production) bounces back and continues its increase from previous years.
The projected growth in future plastic production and consumption (OECD, 2022) means that GHG emissions from plastics are expected to grow. A more circular plastics system would reduce GHG emissions by reducing demand for virgin plastics and producing less waste.
Circularity of plastics material is increasing slowly
A key concept and set of tools to deal with the environmental, climate and health impacts of growing plastic production and consumption is the circular economy (EEA 2024c). This has been a key political priority for the EU on plastics (see the European plastics strategy, the Single-Use Plastics Directive and the circular economy action plan).
Despite these efforts, the circularity of plastics materials is only increasing slowly, and more efforts are needed from a broad range of stakeholders - including industry, NGOs, research communities, and the public sector. This section provides insights into plastics circularity in Europe based on the metrics we have identified and on previous analyses of pathways to circular plastics and good examples of plastics circularity (EEA, 2023b and EEA, 2020b).
The use of recycled plastics materials
The circular material use rate is a way to measure how much plastics material is recycled into new products. It is not enough to collect plastics for recycling: it must be used in new products, which in turn can reduce demand for virgin plastics.
The use of recycled plastics material, as a proportion of the total amount of plastic used, reached 8.1% in 2020, up from 6.8% in 2018 (EEA, 2024a). This increase is due to both a higher uptake of recycled materials and a small decrease in plastic consumption in the EU in 2020.
Compared to the overall use of recycled materials in the EU (the circular material use rate), we see that plastics are lower than the EU average for all materials, which was 11.7% in 2020. The results are not fully comparable, however, because the calculation methods are slightly different. Ways to increase the circular material use rate for plastics include eliminating problematic and avoidable plastic products, better design and sorting mechanisms, and investing in increased recycling capacity.
Exports of plastics waste
Plastics waste exports from the EU have declined significantly since 2016. This decline is linked to China’s 2018 waste import ban, amendments in the Basel Convention and EU policies towards an increase in recyclable material quality, as well as investments in domestic recycling capacity.
The decline in the EU’s plastic waste exports is partly compensated for by increased intra-EU trade of plastic waste. Since 2017, it has surpassed EU exports of plastic trade (ETC CE, 2024). The recent updates of the EU legislation on waste shipments prohibits all exports of plastics waste from the EU to non-OECD countries. Only if strict environmental conditions are met can individual countries receive such waste (EC, 2023b).
Exporting less plastics waste means that we must handle more of our waste inside Europe, will require further efforts to increase plastics recycling. This is a positive sign for the circularity of plastics in the EU and also helps prevent the mismanagement of EU plastic waste.
EU’s plastics waste mechanical recycling capacity
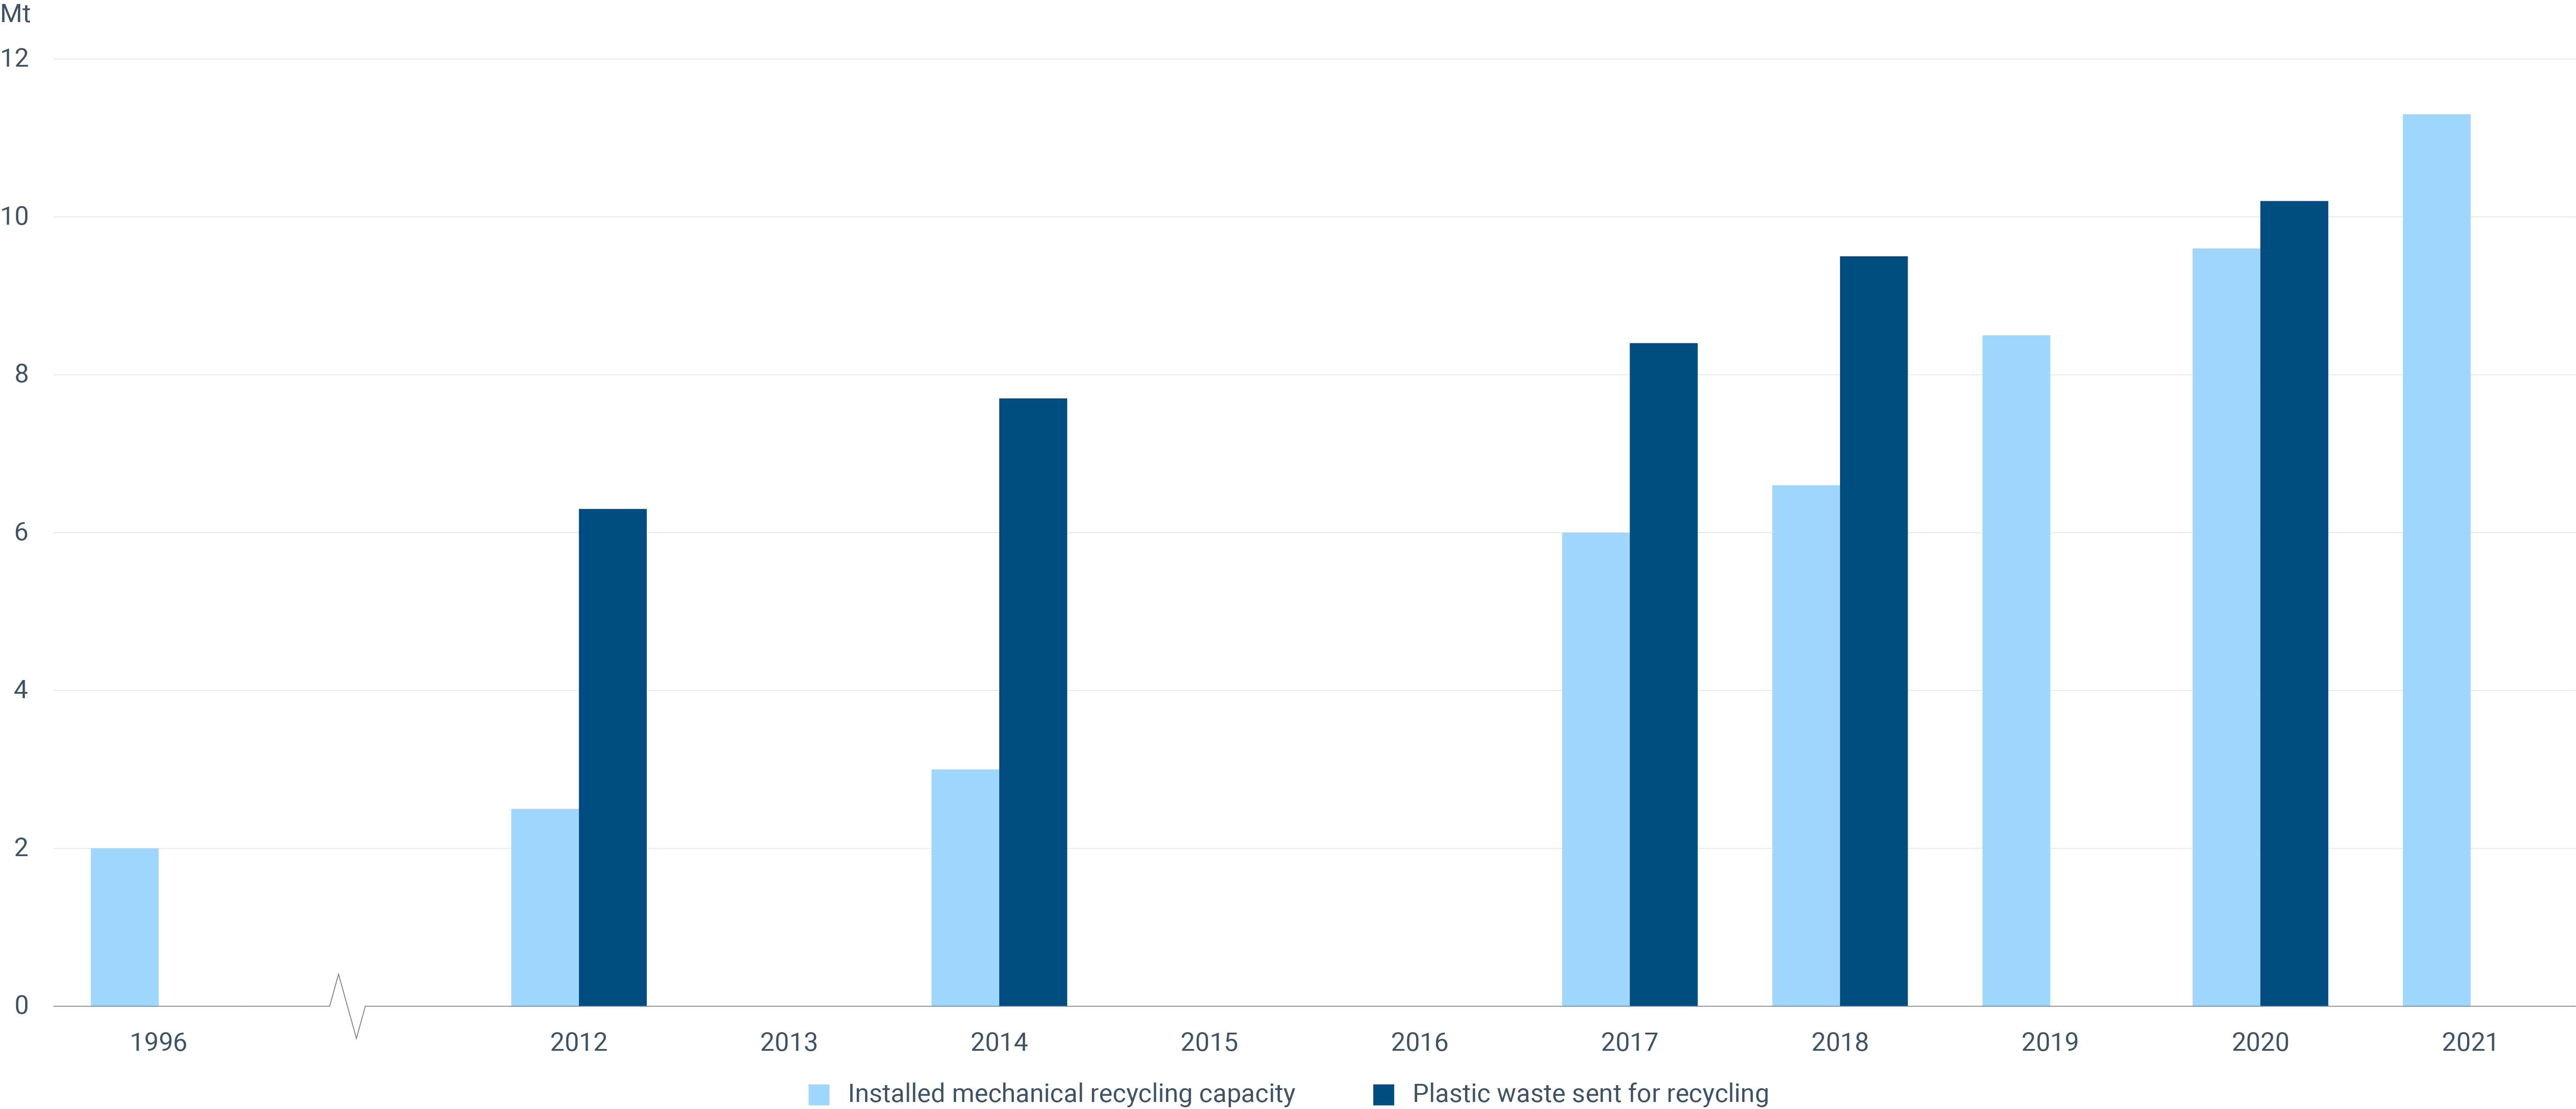
An adequate recycling capacity is necessary for increasing plastic recycling rates in the EU. Plastic recycling done in the EU, can reduce costs, adhere to EU environmental standards and offers a nearby secondary raw material source for EU manufacturers. Therefore, monitoring the EU’s recycling capacity as an enabler of plastic waste recycling is important for plastics circularity in Europe.
In the EU, 99% of recycling capacity is mechanical recycling (JRC, 2022). Mechanical recycling processes plastic waste into plastic recyclates without significantly changing its chemical structure.
Mechanical recycling capacity for plastics in Europe has significantly increased since 1996 from 2Mt to 11.3Mt in 2021 (Plastic Recyclers Europe, 2021). This represents an almost six-fold increase, reflecting the heavy investments and significant legislative focus on boosting plastics recycling.
Until recently, we did not have enough capacity to process the plastic waste collected for recycling in the EU. This means that the EU was not self-sufficient and EU waste operators had no choice but to export waste for recycling. However, recently, mechanical recycling capacity has been increasing faster than the plastic waste collected. As a result, we can now handle all the plastic waste sent for recycling. The problem is that not all plastic waste is collected or sent to recycling, in particular non-packaging plastics and plastics embedded into other products (ETC/CE 2022).
Collecting and sending high amounts of plastics for recycling do not necessarily lead to equally high amounts of recycled plastics produced. One key challenge is losses during plastic waste processing. Currently, the plastic recyclates produced by mechanical recycling plants were only about 65% of the plastic waste entering such facilities (JRC, 2022). Hence, more emphasis should be placed on minimising plastic waste in the first place.
Notes: Data gaps exist for 1996-2011, 2013, 2015-2016.
Sources: Reproduced from Plastics Europe, 2012, 2014, 2017, 2018, 2020.
Click here for different chart formats and data
Average price of plastic scrap
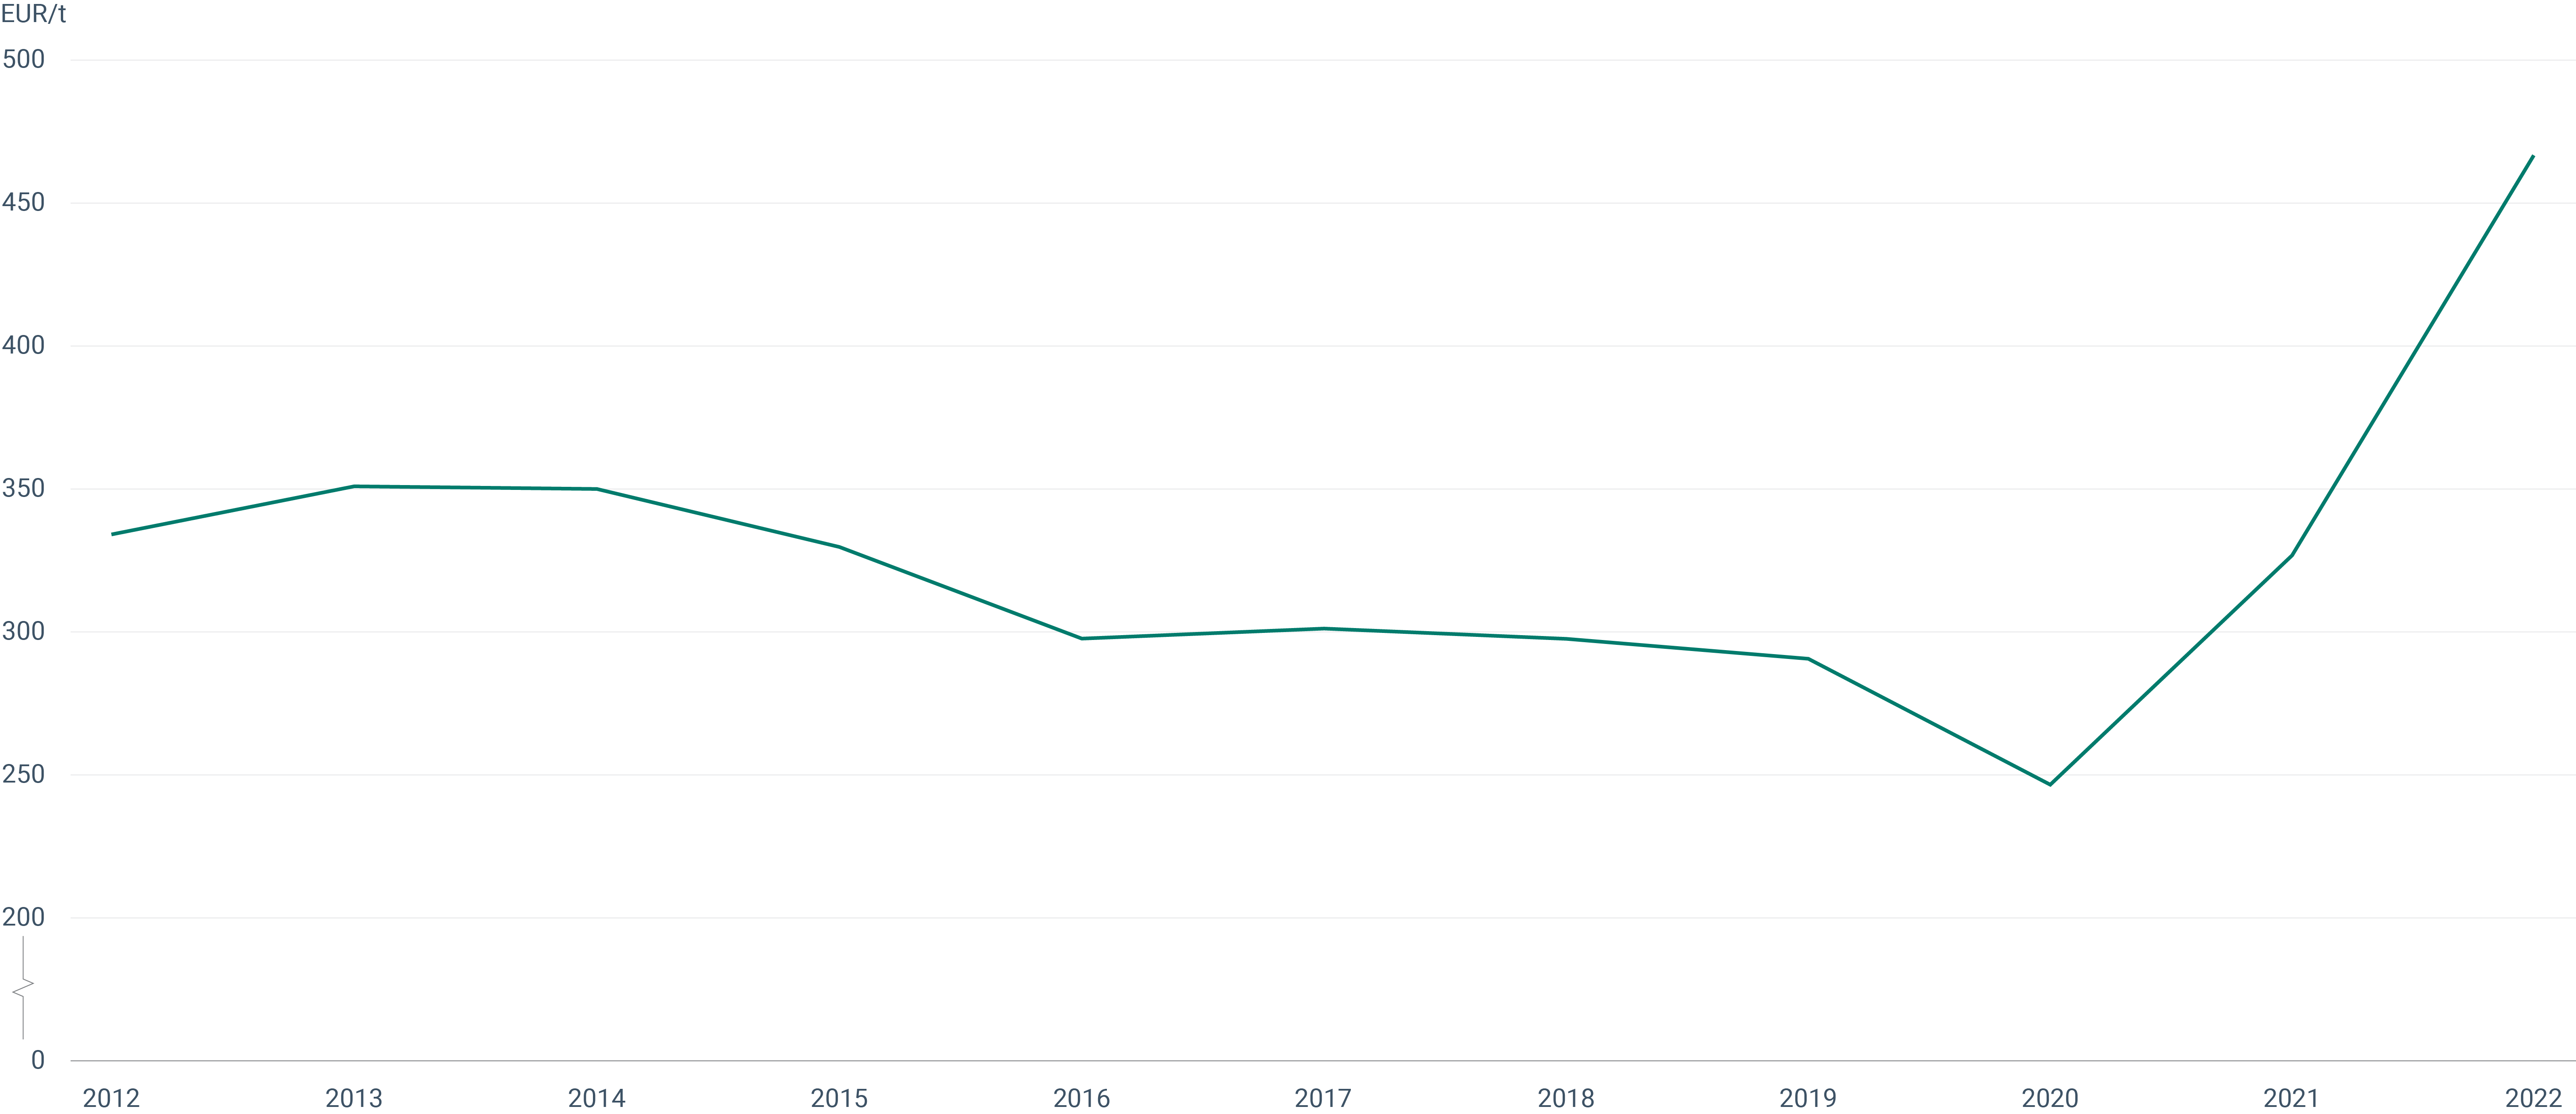
A well-functioning market for recycled plastics is a positive sign for the circular economy. The price of plastics scrap can indicate how the market is doing (although several factors play a role).
Overall, if the price of plastic scrap (destined for recycling) increases, it can indicate that the general quality of plastic scrap is improving, which is good for circularity as high-quality scrap is easier to recycle. On the other hand, higher scrap prices may also mean that recycled plastics are more expensive compared to virgin, which is bad for circularity as it may dissuade producers from buying recycled instead of virgin plastics.
Figure 5 shows that the average price of plastic scrap was 334 EUR/tonne in 2012, while the lowest value was reached in 2020 (247 EUR/tonne). Since then, the price has increased considerably, reaching 467 EUR/tonne in 2022, an increase of 90% over two years.
It is difficult to say exactly why the price increased this much over a few years, but it is likely linked to: (1) trade restrictions on plastic waste which may have led to an increase in the quality of traded plastic scrap, as low-quality plastic waste was increasingly banned; (2) the recent EU policymaking focus on recycling and increased demand for recycled plastics may also boost the price of scraps; and (3) since scrap is used to produce secondary raw materials, price developments of virgin plastic can also have a direct impact on the price for plastic scrap.
Source: Eurostat, 2024a.
Click here for different chart formats and data
References
EC, 2020, ‘Plastics strategy’ (https://environment.ec.europa.eu/strategy/plastics-strategy_en), accessed 10 June 2024.
EC, 2023a, EU action against microplastics, Publications Office of the European Union, Luxembourg (https://data.europa.eu/doi/10.2779/917472), accessed 10 June 2024.
EC, 2023b, ‘Political agreement reached on new Regulation on waste shipments’ (https://ec.europa.eu/newsroom/env/items/816170/), accessed 10 June 2024.
EC, 2023c, Proposal for a Regulation on preventing pellet losses, (https://environment.ec.europa.eu/publications/proposal-regulation-preventing-pellet-losses_en), accessed 10 June 2024.
EC, 2023d, ‘Protecting environment and health: Commission adopts measures to restrict intentionally added microplastics’ (https://ec.europa.eu/commission/presscorner/detail/en/ip_23_4581), accessed 10 June 2024.
EEA, 2020a, ‘Biodegradable and compostable plastics — challenges and opportunities’ (https://www.eea.europa.eu/publications/biodegradable-and-compostable-plastics), accessed 10 June 2024.
EEA, 2020b, Plastics, the circular economy and Europe′s environment, EEA Report No 18/2020, European Environment Agency (https://www.eea.europa.eu/publications/plastics-the-circular-economy-and), accessed 10 June 2024.
EEA, 2023a, ‘From source to sea — The untold story of marine litter’ (https://www.eea.europa.eu/publications/european-marine-litter-assessment), accessed 10 June 2024.
EEA, 2023b, ‘Pathways towards circular plastics in Europe — good practice examples from countries, business and citizens’ (https://www.eea.europa.eu/publications/pathways-towards-circular-plastics-in), accessed 10 June 2024.
EEA, 2024a, ‘Circularity Metrics Lab’ (https://www.eea.europa.eu/en/circularity), accessed 10 June 2024.
EEA, 2024b, ‘Marine litter’ (https://www.eea.europa.eu/en/datahub/datahubitem-view/fc3a040f-ee73-4747-97c1-458c02108cf5), accessed 10 June 2024.
EEA, 2024c, ‘Accelerating the circular economy in Europe – State and outlook 2024’ (https://www.eea.europa.eu/publications/accelerating-the-circular-economy), accessed 10 June 2024.
ETC/CE, 2022, Non-packaging plastics in Europe, ETC/CE Report 2022/7 (https://www.eionet.europa.eu/etcs/etc-ce/products/etc-ce-report-2022-7-non-packaging-plastics-in-europe), accessed 10 June 2024.
ETC/CE, 2024, Drivers of EU plastic waste exports, ETC/CE Report 2024/2 (https://www.eionet.europa.eu/etcs/etc-ce/products/etc-ce-report-2024-2-drivers-of-eu-plastic-waste-exports), accessed 10 June 2024.
ETC/ICM, 2022, Marine Litter Watch (MLW) 2021 European Beach Litter Assessment, ETC/ICM Report 6/2022 (https://www.eionet.europa.eu/etcs/etc-icm/products/etc-icm-reports/etc-icm-report-6-2022-marine-litter-watch-mlw-2021-european-beach-litter-assessment), accessed 10 June 2024.
ETC/WMGE, 2021, Greenhouse gas emissions and natural capital implications of plastics (including biobased plastics), ETC/WMGE Report 3/2021 (https://www.eionet.europa.eu/etcs/etc-wmge/products/etc-wmge-reports/greenhouse-gas-emissions-and-natural-capital-implications-of-plastics-including-biobased-plastics), accessed 10 June 2024.
EU, 2019, Directive (EU) 2019/904 of the European Parliament and of the Council of 5 June 2019 on the reduction of the impact of certain plastic products on the environment (Text with EEA relevance) (OJ L 155, 12.6.2019, pp. 1-19).
European Bioplastics, 2023, ‘Bioplastics market development update 2023’ (https://www.european-bioplastics.org/bioplastics-market-development-update-2023-2/), accessed 10 June 2024.
Eurostat, 2024a, ‘EU trade since 1988 by HS2-4-6 and CN8’ (https://ec.europa.eu/eurostat/databrowser/view/DS-045409__custom_6401577/default/table?lang=en), accessed 10 June 2024.
Eurostat, 2024b, ‘Sold production, exports and imports’ (https://ec.europa.eu/eurostat/databrowser/product/page/DS-056120__custom_6306626), accessed 10 June 2024.
JRC, 2022, Modelling plastic flows in the European Union value chain, Joint Research Centre (https://publications.jrc.ec.europa.eu/repository/handle/JRC130613), accessed 10 June 2024.
OECD, 2022, Global Plastics Outlook: Policy Scenarios to 2060, OECD Publishing, Paris (https://www.oecd.org/publications/global-plastics-outlook-aa1edf33-en.htm, accessed 10 June 2024.
Plastic Recyclers Europe, 2021, Plastics recycling industry in Europe, mapping of installed plastics recycling capacities (https://www.plasticsrecyclers.eu/wp-content/uploads/2022/10/plastics-recycling-industry-in-europe.pdf), accessed 10 June 2024.
Plastics Europe, 2012, Plastics - the Facts 2012 (https://plasticseurope.org/knowledge-hub/plastics-the-facts-2012/), accessed 10 June 2024.
Plastics Europe, 2014, Plastics - the Facts 2014 (https://plasticseurope.org/knowledge-hub/plastics-the-facts-2014/), accessed 10 June 2024.
Plastics Europe, 2017, Plastics - the Facts 2017 (https://plasticseurope.org/knowledge-hub/plastics-the-facts-2017/), accessed 10 June 2024.
Plastics Europe, 2018, Plastics - the Facts 2018 (https://plasticseurope.org/knowledge-hub/plastics-the-facts-2018/), accessed 10 June 2024.
Plastics Europe, 2019, Plastics - the Facts 2019 (https://plasticseurope.org/knowledge-hub/the-circular-economy-for-plastics-a-european-overview/), accessed 10 June 2024.
Plastics Europe, 2020, Plastics - the Facts 2020 (https://plasticseurope.org/knowledge-hub/plastics-the-facts-2020/), accessed 10 June 2024.
Plastics Europe, 2022a, Plastics - the Facts 2022 (https://plasticseurope.org/knowledge-hub/plastics-the-facts-2022/), accessed 10 June 2024.
Plastics Europe, 2022b, The Circular Economy for Plastics, A European Overview (https://plasticseurope.org/wp-content/uploads/2022/06/PlasticsEurope-CircularityReport-2022_2804-Light.pdf), accessed 10 June 2024.
Identifiers
Briefing no. 05/2024
Title: The role of plastics in Europe’s circular economy
EN HTML: TH-AM-24-006-EN-Q - ISBN: 978-92-9480-644-4 - ISSN: 2467-3196 - doi: 10.2800/6297
EN PDF: TH-AM-24-006-EN-N - ISBN: 978-92-9480-643-7 - ISSN: 2467-3196 - doi: 10.2800/30


Document Actions
Share with others