4.6 Data reported
for 1989-1995.
The data reports for previous years are
available for various Member States: for Austria for the period
1993-1995, for Denmark and Finland information for 1992-1995 is
available. For the period 1989-1995 data reports are available
for four Member States (Belgium, Luxembourg, the Netherlands and
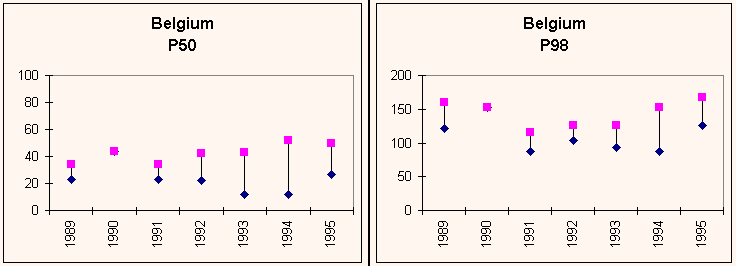
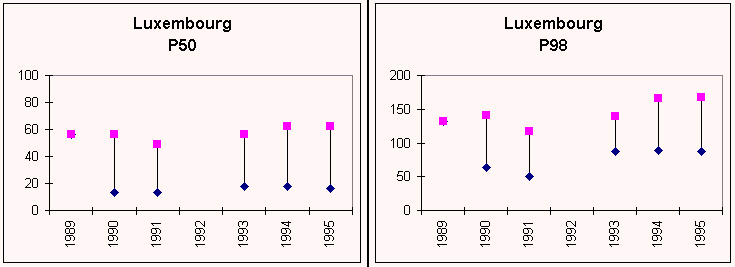
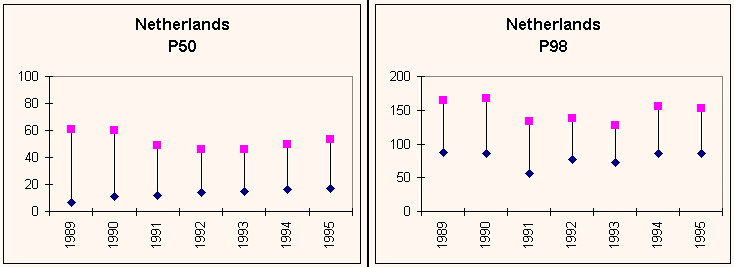
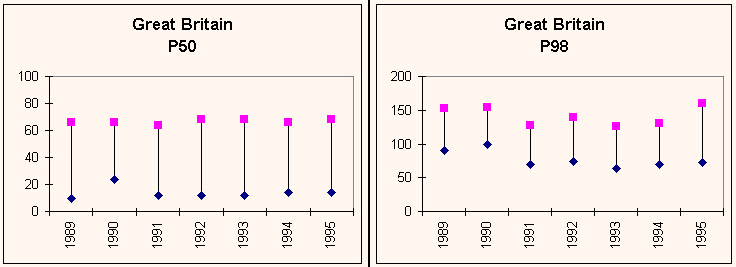
United Kingdom), see Figure 12. In discussing the time series of
50 and 98 percentile, the reader must be aware that the network
(number and location of stations, measuring method etc.) might
have been changed during the years.
The year-to-year variation in 50-percentile
values are relatively small when compared to the variations in
the 98-percentile values (see Figure 12). Peak values of ozone
are strongly correlated with temperature mainly because the
conditions leading to high temperatures (e.g. strong solar
radiation, low wind speeds, continental flows) also trigger
photochemical formation. Meteorological fluctuations may cause
variations in peak ozone levels that are much larger than the
variations due to changes in precursor emissions. A yearly
fluctuation of ca. 15% in 98-percentile value is not exceptional.
The yearly fluctuations differ from country
to country. In Belgium, Luxembourg and the Netherlands similar
patterns are found: after two "high" years (1989 and
1990) the period 1991-1993 shows relatively low peak values but
increased levels are again observed in 1994. In contrast to
Luxembourg and the Netherlands where peak values in 1995 are
lower than in 1994, in Belgium and the United Kingdom the
98-percentile value even further increased in 1995.
The available time series are too short to
detect any possible trend in ground level ozone concentrations in
the EU. Trends in ozone concentrations are expected to result
from trends in precursor emissions in Europe and from the
increasing trend in hemispheric background concentrations
(Borrell and van den Hout, 1995). The magnitude and even the sign
of a possible trend will differ from location to location. In a
study of trends in concentrations of ozone and related species in
the Netherlands and nearby countries Roemer (1996) concluded that
the ground level oxidant (sum of ozone and NO2) concentrations
have decreased significantly in the Netherlands from 1981 to 1994
with an average decrease of about 1% per year. For Germany a
slightly downward (northern part) or slightly upward (southern
part) trend was noted but probably none of these trends is
significant at the 95% confidence interval (Roemer, 1996). Based
on the data reported here in the framework of the Ozone
Directive, no conclusive answers can be given.


Figure 12. Range in reported 50-percentile values (in µg/m3,
based on hourly concentrations) and 98-percentile values (in
µg/m3, based on hourly concentrations) in Belgium, Luxembourg,
the Netherlands and United Kingdom in the period 1989-1995.


Document Actions
Share with others