All official European Union website addresses are in the europa.eu domain.
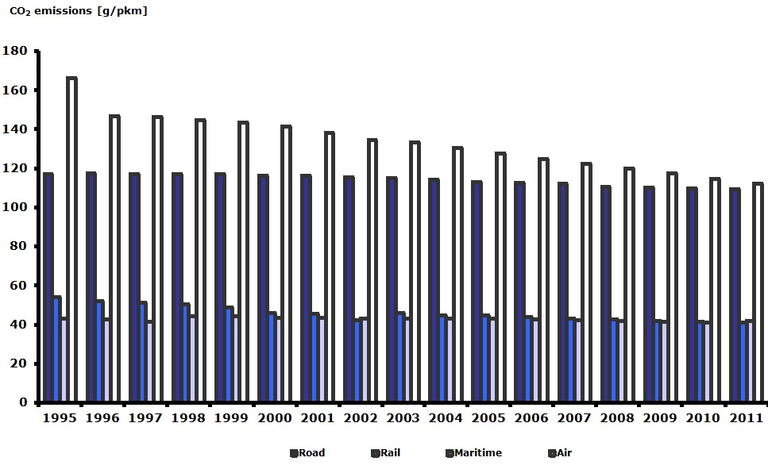
See all EU institutions and bodiesThe graph shows development of specific CO2 emissions, defined as emissions of CO2 per transport unit (passenger-km), by passenger transport mode (road, rail, maritime, air) over the period 1995 to 2011.
Data coverage: EEA-32 excluding Iceland and Liechtenstein
Loading

