All official European Union website addresses are in the europa.eu domain.
See all EU institutions and bodies
An official website of the European Union | How do you know?
Environmental information systems
Key messages: The European Environment and Health Atlas (EEHA) collects and displays information on how pollution affects European residents’ health. It features information on air and water pollution, industrial pollutant emissions and environmental noise, among other environmental risks.The information is always displayed at the most disaggregated level possible, focusing on local level information when available.
The EEA’s EEHA is a digital resource showcasing how the environment affects the health and wellbeing of European residents. It is a compilation of data and maps providing key information about environmental quality and risks across Europe. It is also a specific deliverable under the European Commission’s Zero Pollution Action Plan (EC, 2021). Pollution data are the backbone of the Atlas, specifically air and water pollution, as well as environmental noise.
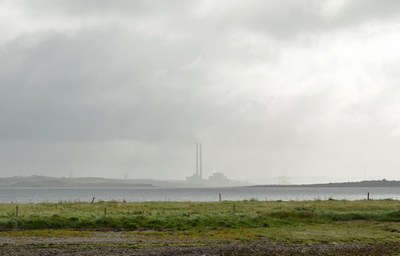
The section on air pollution contains interactive maps with annual average concentrations of key pollutants — fine particulate matter (PM2.5), nitrogen dioxide (NO2) and ozone (O3) — as well as the population that is exposed to harmful levels of concentrations of these pollutants, the preventable deaths they cause and the resulting loss of years of life across Europe (EEA, undated). It also features industrial emissions data from the European Industrial Emissions Portal, specifically for air pollutants with well-known health impacts like heavy metals, PM, sulphur oxides (SOx) and nitrogen oxides (NOx).
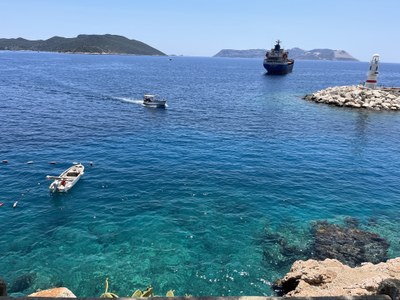
The EEHA also covers industrial emissions of heavy metals into water under the European Industrial Emissions Portal (EIEP, undated) and data from the state of bathing waters visualiser (EEA, 2024). Concerning noise, the EEHA features maps on urban noise levels, quiet areas, and noise around schools and hospitals, as well as a viewer on combined health impacts of road traffic noise and air pollution for selected urban areas. In addition, some of the Atlas’ maps and viewers focus on inequalities of exposure to pollution related to income and age.
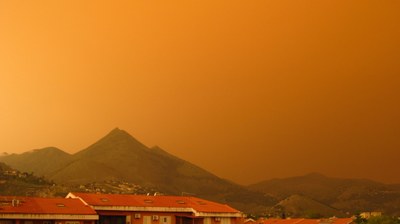
While the EEHA is intended as a communication product and not an analytical tool, it reveals intra-European differences in exposure and health impacts of various pollutants. For example, concentrations of PM2.5 are overall higher towards eastern Europe, though hot spots are also present elsewhere. O3 concentrations tend to be higher towards the south, because of meteorological variables related to their formation. A spatial co-occurrence of high PM2.5 concentrations and low GDP per capita (adjusted by purchasing power) points to systematic differences in air pollution exposure according to wealth.
Lastly, to make this information locally-relevant for European residents, the EEHA features a ‘check your place’ widget that allows people to instantly generate an ‘environment and health scorecard’ with key information on environmental risks including pollution where they live, work or spend time. A ‘learn more’ section provides additional information on each area, sources of data, key publications and explanatory videos with EEA experts.
Please consult the relevant indicators and signals below for a more comprehensive overview on the topic.
Zero Pollution Action Plan 2030 target or policy objectives
Reduce by more than 55 % the health impacts (premature deaths) of air pollution.
Reduce the share of people chronically disturbed by transport noise by 30%.
Develop a ‘European Environment and Health Atlas’ (EC, 2021).
Return to the main pages:
Other relevant indicators and signals

References and footnotes
- EC, 2021, Communication from the Commission to the European Parliament, the Council and Social Committee and the Committee of the Regions ‘Pathway to a Healthy Planet for All EU Action Plan: ‘Towards Zero Pollution for Air, Water and Soil’’ (COM/2021/400 final).a b
- ↵EEA, undated, ‘Air pollution’, European Environment and Health Atlas, European Environment Agency (https://discomap.eea.europa.eu/atlas/?page=Air-pollution&views=Population-exposed%2CPM%E2%82%82.%E2%82%85-fine-particles-) accessed 09 September 2024.
- ↵EIEP, undated, ‘Welcome to the European Industrial Emissions Portal’ (https://industry.eea.europa.eu/) accessed 9 September 2024.
- ↵EEA, 2024, ‘State of bathing waters’, European Environment Agency (State of bathing waters in 2023 — European Environment Agency (europa.eu)) accessed 09 September 2024.