All official European Union website addresses are in the europa.eu domain.
See all EU institutions and bodies
An official website of the European Union | How do you know?
Environmental information systems
Europe’s biodiversity continues to be shaped by human activity. Pressures to habitats and species remain high and are expected to further impact habitat quality and ecosystem conditions.
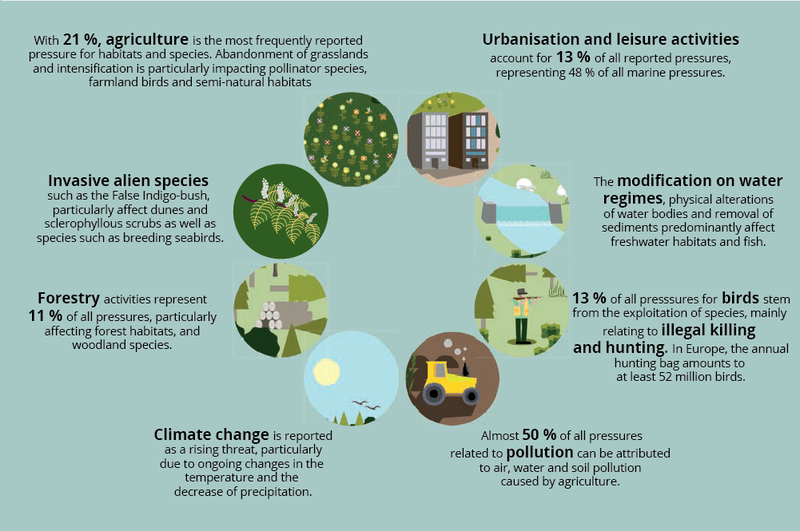
Over 67,000 individual pressures have been reported at European Union (EU) level. According to the latest EEA report on the ‘State of nature’, the most frequently reported pressures on habitats and species are associated with agriculture. This is followed by urban sprawl and leisure activities and unsustainable forestry activities. Pollution of air, water and soil also impacts most habitats and species, particularly in the EU’s Atlantic and Continental regions.
67,000
individual pressures on habitats and species reported by Member States
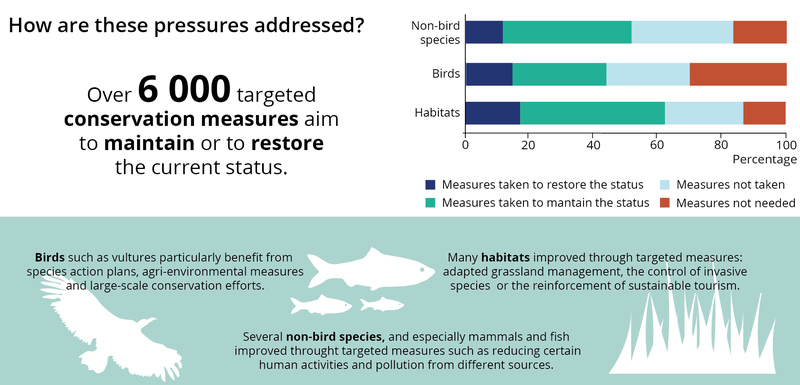
How are these pressures addressed?
Well-designed conservation strategies and their proper implementation on the ground can help improve the health of our nature. Conservation measures for habitats include, for example, reinstating appropriate grassland management or reducing the use of fertilisers. Actions to prevent the loss of natural habitats also help the conservation of species. At least 226,000 km2 of habitats need to be restored to ensure their long-term viability according to the reports of Member States.
Conservation strategies will not be effective without stronger societal responses and systems transformation
Our assessment indicates that despite conservation measures being taken for most habitats and species, conservation status and trends have not significantly improved, and continue to show ongoing deterioration. This may indicate that conservation measures, that have not yet been taken, are key to delivering conservation objectives, and measures, that are not fully implemented, either were not effective or need to be scaled up.
However, pressures exerted on Europe’s biodiversity cannot be addressed only by conventional conservation measures. Their success will entail changing some of our current behaviours, for example, the way we produce and consume our food, build our cities, produce energy and interact with nature.
Top 3 groups of pressures:
- Agricultural activities represent the most common pressure group across habitats and species (21% of all reported pressures). Intensification, fragmentation and abandonment are particularly impacting pollinators, birds and semi-natural habitats.
- Urbanisation and leisure/tourism represent 13% of all reported pressures. 48% of pressures impact marine and coastal species and habitats.
- Forestry accounts for 11% of all reported pressures, impacting forest habitats and woodland species the most.
Other important pressures:
- Invasive alien species, predominantly impacting amphibians, fish, birds and plants.
- Pollution to air, water and soil, caused in large part by agricultural activities (50%). Changes in rivers, for example, the quantity of water abstraction for different uses and physical modifications (e.g. dams/weirs, canalisation, drainage of rivers for navigation), impact freshwater habitats and fish the most. Drainage (14%) and hydropower (13%) contribute to this pressure group.
- Species exploitation includes illegal shooting or killing (27%) and hunting (19%), as well as bycatch (10%).
- Climate change is considered as a rising pressure.
For the complete analysis of bird populations, see the latest EEA report on the ‘State of nature’.
- Explore our data on the state of nature
Background information
The EEA report on the ‘State of nature’, looks jointly at the results from EU Birds and Habitats Directives. These directives emphasise the need for Member States to design and implement conservation measures to respond to pressures with mandatory requirements for Natura 2000 sites.
Member States have reported over 200 different types of pressures categorised into 15 overarching categories. Moreover, over 100 conservation measures are listed in 13 main categories, corresponding to the pressure sectors identified.