All official European Union website addresses are in the europa.eu domain.
See all EU institutions and bodies
An official website of the European Union | How do you know?
Environmental information systems
Thanks to the reporting by EU Member States, comprehensive data on the state of Europe’s nature is available.
Every six years, EU Member States are required to report on the status of species and habitats covered by the Birds and Habitats Directive. The data delivery from Member States is vital, as it is the basis for a comprehensive assessment of the state of nature from a European perspective. Member States provide extensive knowledge in relation to, among others, conservation status trends, pressures and threats, and conservation measures.
The data delivery from Member States is vital, as it is the basis for a comprehensive assessment of the state of nature from a European perspective.
Reporting under Article 12 of the Birds Directive
Reports covered by Article 12 of the Birds Directive focus on the trends of bird populations and contain information in relation to the pressures and threats, conservation measures and the impact of Natura 2000. Data on birds at the Member State level indicate a high variation in breeding bird populations. Almost all Member States reported more than one-third of breeding populations as increasing or being stable. Almost half of all EU Member States reported decreasing short-term trends for a third of breeding populations.
Short-term trends in breeding bird populations by Member States for the reporting period 2013-2018
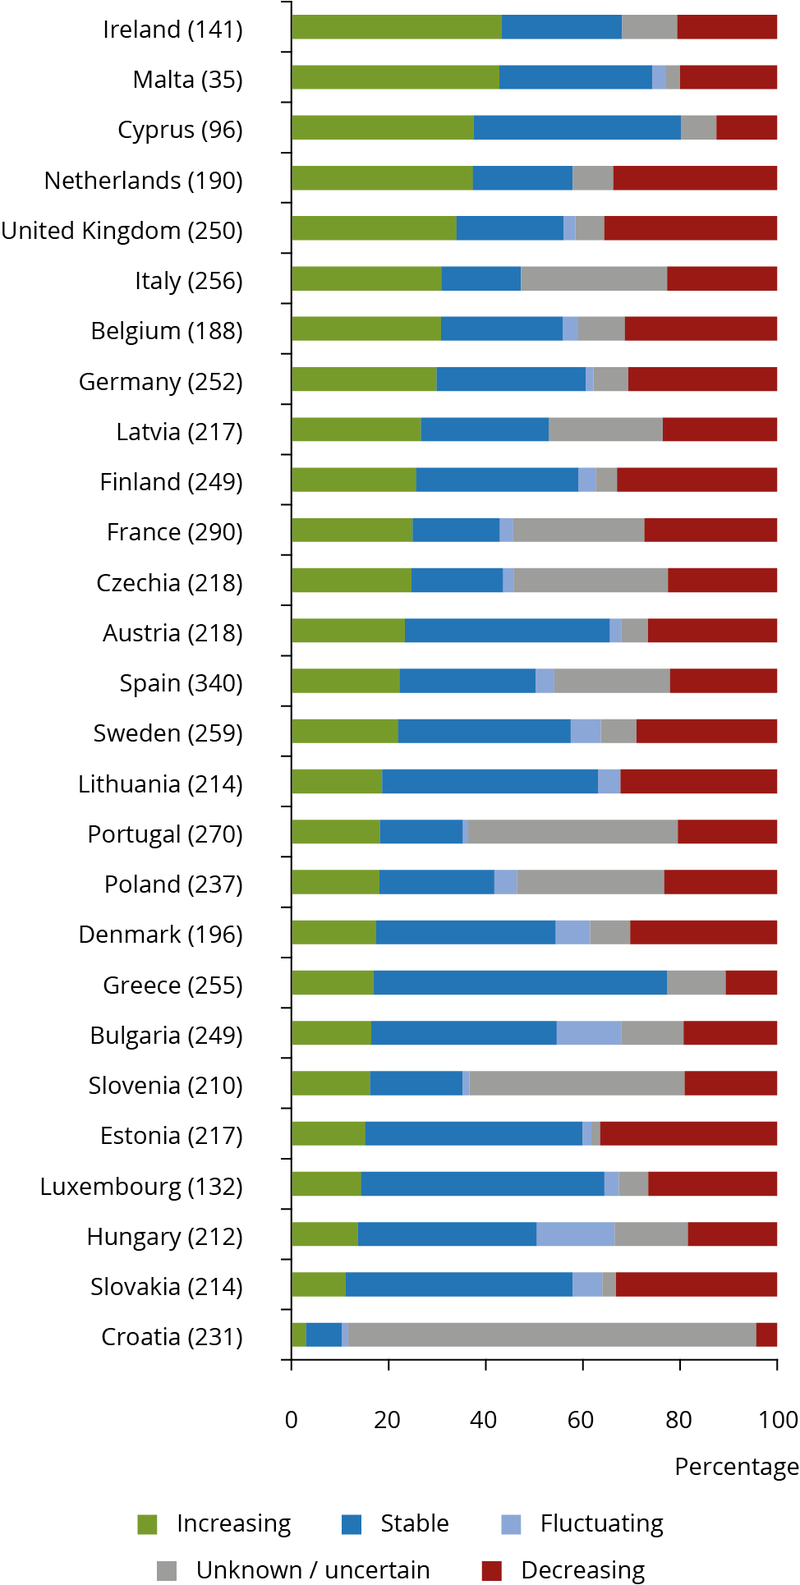
Source: EEA Report, State of nature in the EU
Two-thirds of all Member states reported that more than 30% of wintering populations have increasing or stable trends, while almost half of the Member States indicate that wintering populations are decreasing at a rate of above 15%.
Short-term trends in wintering bird populations by Member States for the reporting period 2013-2018
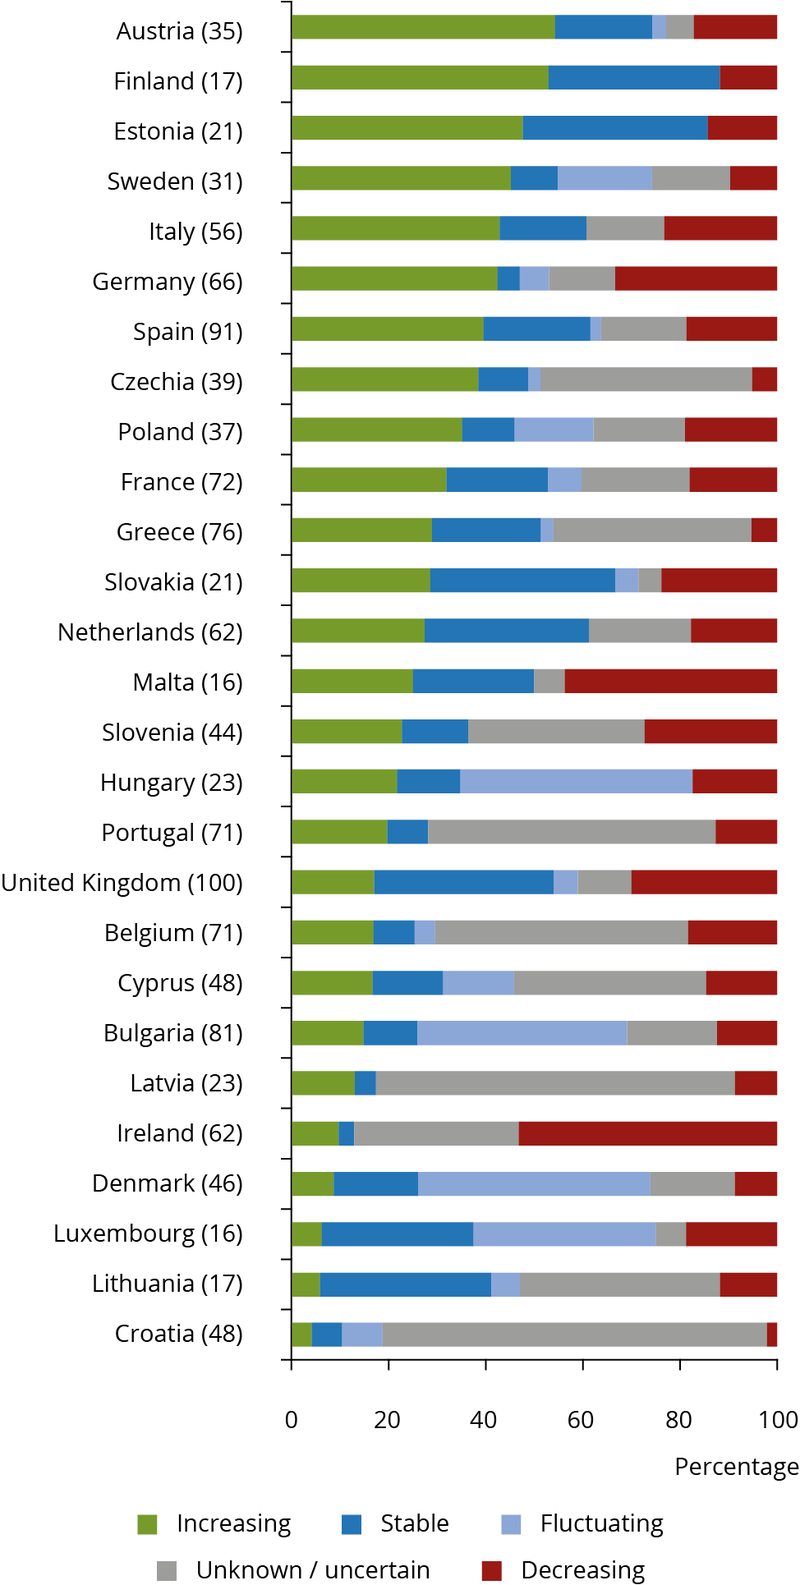
Source: EEA Report, State of nature in the EU
The degree of unknown population trends varies greatly among EU Member States because it depends on whether bird monitoring systems are in place and whether they are effective and provide the appropriate information.
Reporting under Article 17 of the Habitats Directive
The key element of the reports covered by Article 17 of the Habitats Directive is the assessment of the conservation status and trends of species and habitats. This is complemented with information on the main pressures and threats, conservation measures and the impact of Natura 2000 network.
The reports by Member States show highly diverse results on conservation status of habitats and species across the EU territory and generally, Member States reported a higher proportion of unknown assessments for species than for habitats. Regarding habitats, most Member States have a good conservation status for less than 40% of their habitat assessments. On average, 6% of all habitat assessments show improvements, particularly forests and freshwater habitats. On the other hand, improvements for rocky habitats are rarely reported.
Conservation status of habitats by Member States for the reporting period 2013-2018
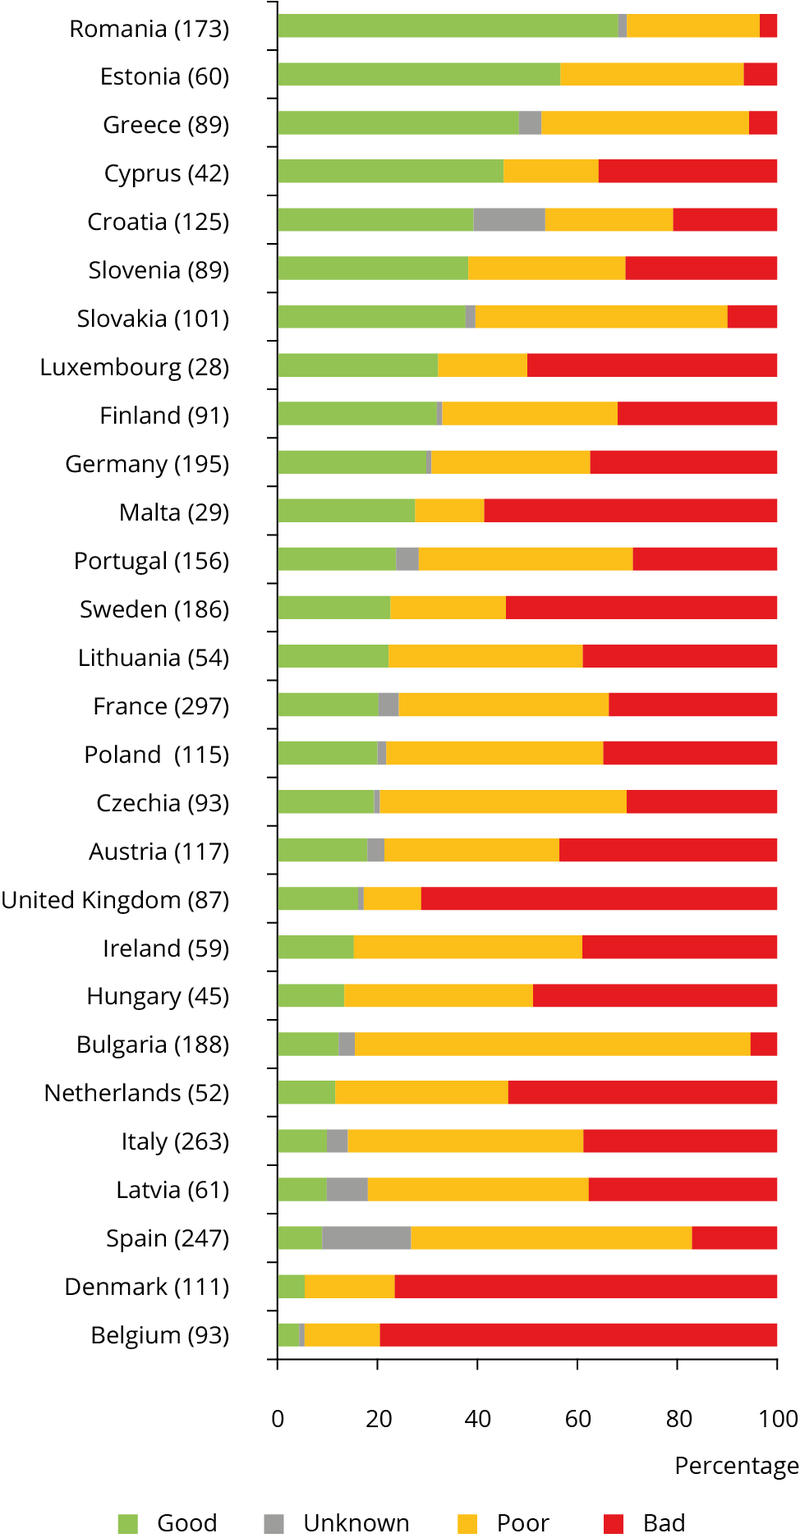
Source: EEA Report, State of nature in the EU
On average, 6% of all species assessments show improvements. The species group with the largest number of improvements is mammals, followed by fish and vascular plants. Nearly 80% of species showing improvements in status and/or trends are animals and 20% are plant species. One-fifth of species assessments in 80% of Member States recorded a deteriorating trend, which indicates that species with a deteriorating trend do not score as highly as in the habitat assessments. Species have in general better conservation status than habitats.
Conservation status of species by Member States for the reporting period 2013-2018
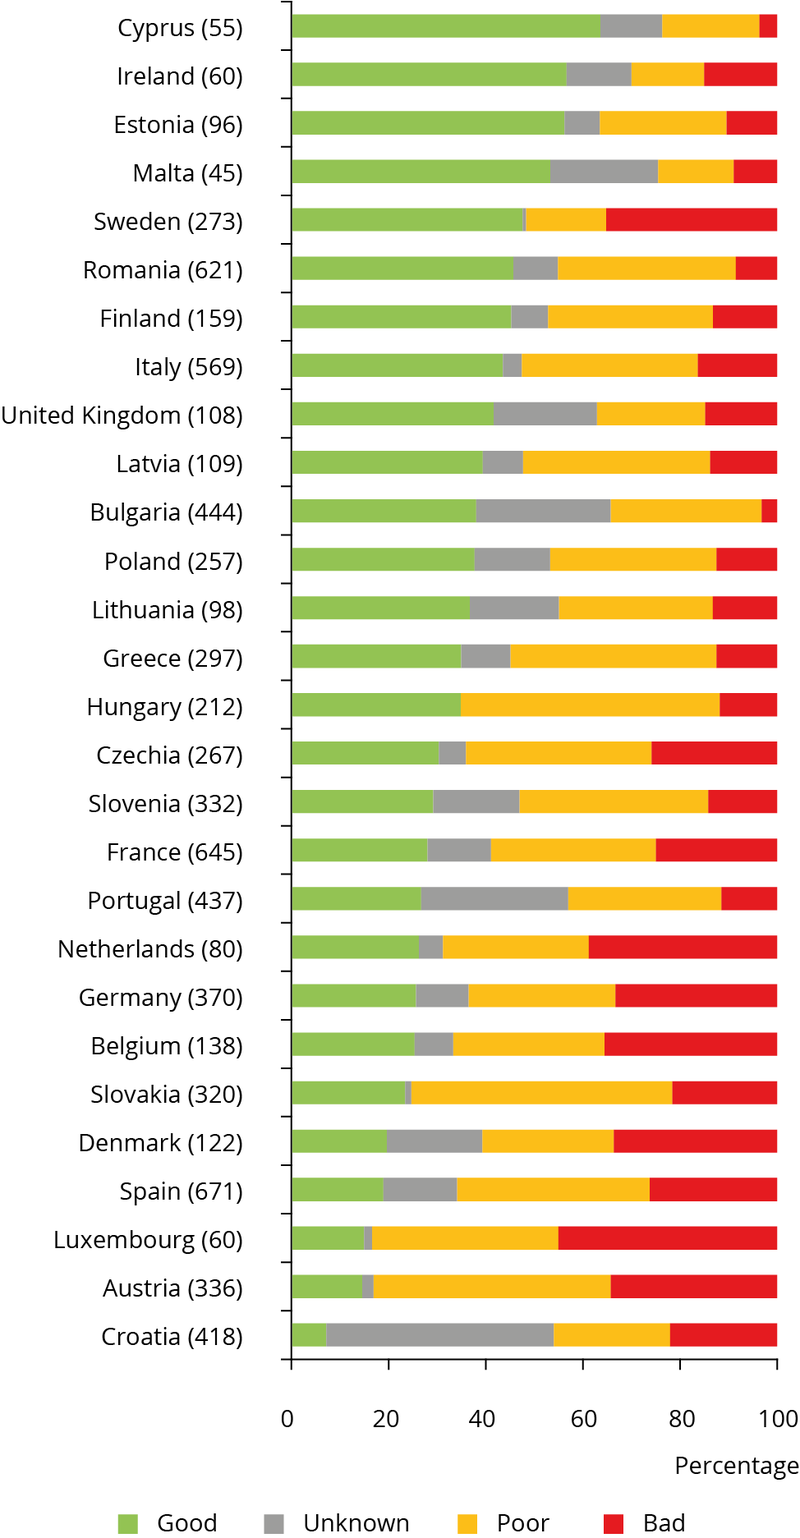
Source: EEA Report, State of nature in the EU
For the complete analysis of bird populations, see the latest EEA report on the ‘State of nature’.
- Explore our data on the state of nature