PM10 stands for particulate matter with a diameter of 10µm or less. PM10 is emitted mainly by the combustion of solid fuels for domestic heating, although industrial activities, agriculture and road transport are also important sources. Some also come from natural sources such as sea salt, Saharan dust or volcanoes, and some (secondary PM) form in the atmosphere as a combination of different gases (for instance, ammonia and nitrogen dioxide). Member States can discount the contribution of natural sources to the total concentrations for compliance assessments as these sources are out of their control, but we do not exclude these sources in this status analysis.
Concentrations above the EU daily limit value for PM10 are seen mainly in Italy and some eastern European countries (Map 1 and Figure 3). In most central and eastern European countries, solid fuels such as coal and wood are widely used for heating households and in some industrial facilities and power plants. The Po Valley in northern Italy is a densely populated and industrialised area with specific meteorological and geographical conditions that favour the accumulation of air pollutants in the atmosphere. Some concentrations are also above the EU daily limit value in southern Spain and the Canary Islands, mainly due to the natural contributions of Saharan dust (MITECO, 2023).
Note: The map shows the 90.4th percentile of the PM10 daily mean concentrations, representing the 36th-highest value in a complete series. It is related to the PM10 daily limit value, allowing 35 exceedances of the 50µg/m3 threshold over one year.
Source: EEA’s AQ e-reporting database.
| Number of countries/Member States > EU daily limit value (50µg/m3) |
23/16 |
15/12 |
| Number of countries/Member States > EU annual limit value (40µg/m3) |
9/4 |
6/3 |
| Number of countries/Member States > WHO daily guideline level (45µg/m3) |
37 (a)/27 |
34 (c)/26 |
| Number of countries/Member States > WHO annual guideline level (15µg/m3) |
35 (b)/26 |
35 (a)/27 |
Note: (a) all the reporting countries; (b) all the reporting countries except Estonia and Iceland; (c) all the reporting countries except Luxembourg.
Source: EEA’s AQ e-reporting database.

In 2022, 16% of monitoring stations measured concentrations of PM10 above the EU daily limit value (Figure 2), 84% of which were urban and 12% suburban.
Furthermore, Italy and Poland reported 2022 exceedances of the PM10 daily limit value based on assessment models for 7 and 13 air quality zones, respectively.
Note: The figure shows, per country, the concentrations of each reported station; the minimum and maximum concentrations; the median and the 25th and 75th percentiles of all the measurements (90.4th percentile of the PM10 daily mean concentrations).
PM2.5 stands for particulate matter with a diameter of 2.5µm or less. These particles are emitted mainly from the combustion of solid fuels for domestic heating, industrial activities and road transport. As with PM10, they can also come from natural sources and can form in the atmosphere. For compliance assessments, Member States can discount the contribution of natural sources to the total concentrations as these sources are out of their control, but in this status analysis, we do not exclude them. Agricultural emissions of ammonia significantly contribute to forming fine particulate matter in the atmosphere.
PM2.5 concentrations above the EU annual limit value were seen in Italy and some eastern European countries (Map 2 and Figure 5). As for PM10, solid fuel use is the main reason for the situation in central and eastern Europe, together with an older vehicle fleet. In northern Italy, the high concentrations are due to the combination of a high density of anthropogenic emissions and also meteorological and geographical conditions that favour the accumulation of air pollutants in the atmosphere and the formation of secondary particles.
Source: EEA’s AQ e-reporting database.
| Number of countries/Member States > EU annual limit value (25µg/m3) |
6/3 |
5/2 |
| Number of countries/Member States > WHO annual guideline level (5µg/m3) |
36 (a)/27 |
34 (a)/27 |
| Number of countries/Member States > WHO daily guideline level (15µg/m3) |
37 (b)/27 |
35 (b)/27 |
Notes: (a) all the reporting countries, except Iceland; (b) all the reporting countries.
Source: EEA’s AQ e-reporting database.

In 2022, 2% of monitoring stations registered concentrations of PM2.5 above the EU annual limit value (Figure 4), 78% of which were urban and 15% suburban. In contrast, 95% of the PM2.5 reporting stations registered concentrations above the WHO annual guideline level, 76% of which were urban and 20% suburban.
Furthermore, Italy and Poland reported exceedances of the PM2.5 annual limit value based on assessment models for three and one air quality zones, respectively.
Regarding the EU standards related to the Average Exposure Indicator[2] for PM2.5, which assesses the general population’s long-term exposure in urban areas, all EU Member States continued to meet the exposure concentration obligation of 20µg/m3 in 2022, set as a 2015 target under the ambient air quality directive[3]. Furthermore, for the first time, all Member States[4] met the national exposure reduction target set for 2020.
Note: The figure shows, per country, the concentrations of each reported station, the minimum and maximum concentrations, the median and the 25th and 75th percentiles of all the measurements (annual mean PM2.5. concentrations).
Ozone (O3) is a pollutant formed in the atmosphere when heat and light cause chemical reactions between nitrogen oxides and volatile organic compounds (VOCs), including methane (which is also a powerful greenhouse gas). Emissions of these gases occur from anthropogenic sources and, in the case of VOCs, also biogenic. Ozone is also transported to Europe from other parts of the northern hemisphere and the upper atmosphere. Meteorology plays an important role in forming and dispersing air pollution, and interannual variations in concentrations. This effect is especially significant for ozone.
Notes: The map shows the 93.2nd percentile of the O3 maximum daily eight−hour mean, representing the 26th-highest value in a complete series. It is related to the O3 target value.
Data are presented here for one year only instead of the average over a three-year period, as stated in the definition of the EU target value for O3.
Source: EEA’s AQ e-reporting database.
The highest concentrations in 2022 were found in some Mediterranean and central European countries (Map 3 and Figure 7).
| Number of countries/Member States > EU target value threshold (120µg/m3) |
22/18 |
20/16 |
| Number of countries/Member States > EU long-term objective (120µg/m3) |
35 (a)/27 |
33 (a)/27 |
| Number of countries/Member States > WHO short-term guideline level (100µg/m3) |
35 (a)/27 |
33 (a)/27 |
| Number of countries/Member States > WHO peak season guideline level (60µg/m3) |
35 (a)/27 |
33 (a)/27 |
Notes: (a) all the reporting countries.
The stations in Kosovo, although reported, did not get the minimum data coverage to estimate the relevant ozone statistics.
Source: EEA’s AQ e-reporting database.
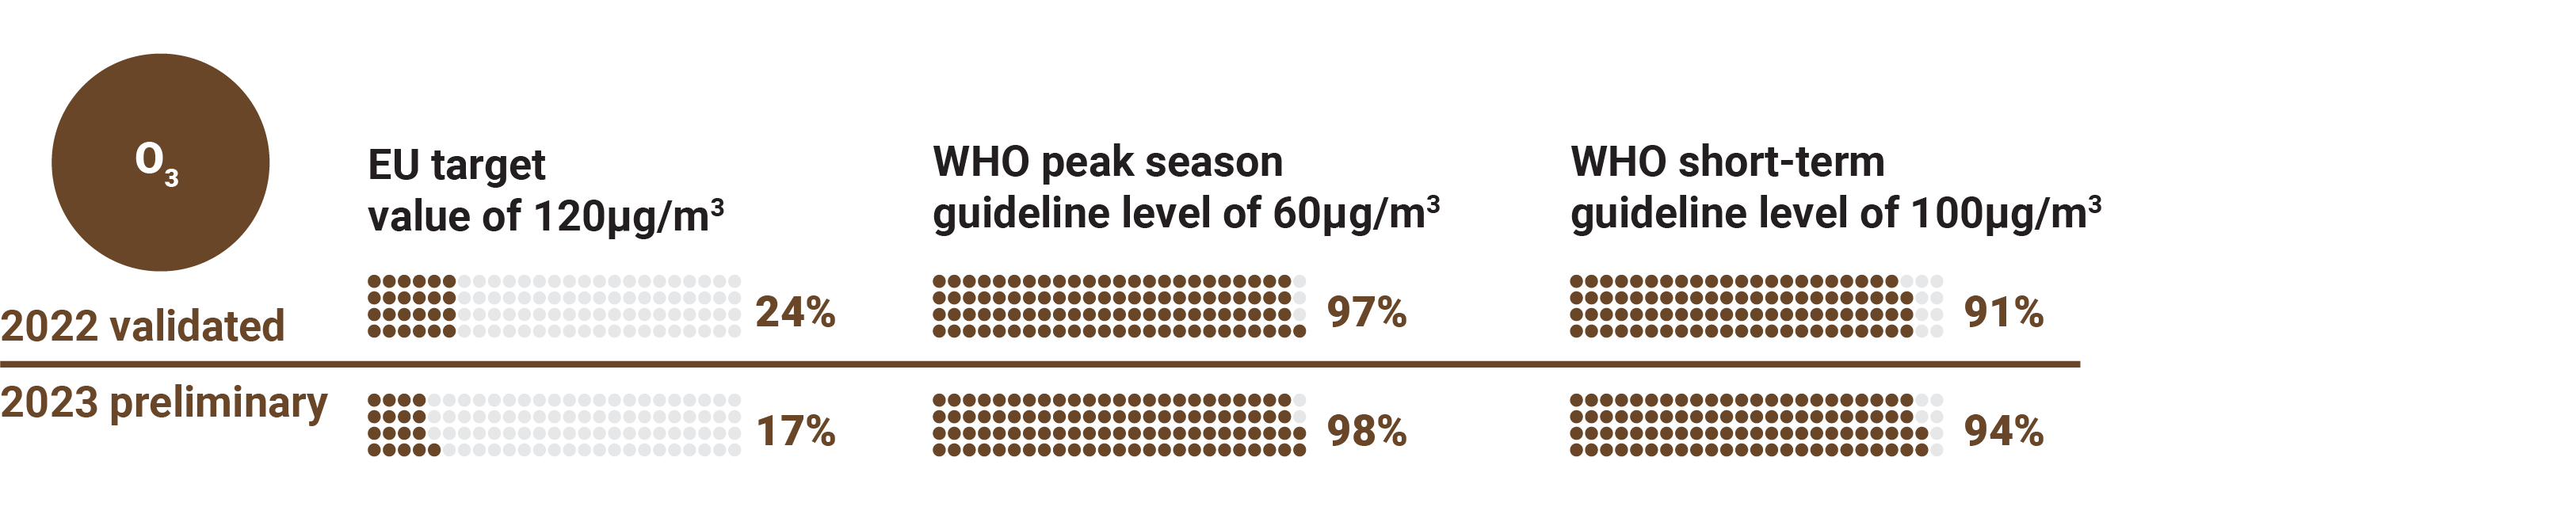
The long-term EU objective for ozone of 120µg/m3 was met at 16% of monitoring stations in 2022.
Italy reported exceedances of the O3 target value for the protection of health based on assessment models for three air quality zones. Italy and Poland reported exceedances of the O3 long-term objective for the protection of health in 9 and 46 air quality zones, respectively.
Note: The figure shows, per country, the concentrations of each reported station, the minimum and maximum concentrations, the median and the 25th and 75th percentiles of all the measurements (93.2nd percentile of O3 maximum daily eight-hour mean).
Data are presented here for one year only, not the average over a three-year period as stated in the definition of the EU target value for O3.
In 2023, the long-term EU objective for ozone was met at 14% of monitoring stations.
The leading source of nitrogen dioxide (NO2) is road transport, which emits NO2 close to the ground, mostly in densely populated areas, contributing to population exposure. Other important sources are combustion processes in industry and energy supply.
Concentrations above the annual limit value were found in many Turkish cities and some big cities with a high volume of traffic (Map 4 and Figure 9).
Source: EEA´s AQ e-reporting database.
| Number of countries/Member States > EU annual limit value (40µg/m3) |
11/10 |
8/8 |
| Number of countries/Member States > EU hourly limit value (200µg/m3) |
2/1 |
2/1 |
| Number of countries/Member States > WHO annual guideline level (10µg/m3) |
37 (a)/27 |
34 (b)/27 |
| Number of countries/Member States > WHO daily guideline level (25µg/m3) |
37 (a)/27 |
34 (c)/27 |
Notes: (a) all the reporting countries; (b) all the reporting countries, except Kosovo; (c): all the reporting countries.
The stations from Kosovo, although reported, did not get the minimum data coverage to estimate the NO2 statistics related to the WHO air quality daily guideline level.
Source: EEA’s AQ e-reporting database.

In 2022, 2% of monitoring stations registered concentrations of NO2 above the EU annual limit value (Figure 8), 76% of which were traffic stations. Concentrations above the NO2 WHO annual guideline level were registered at 74% of all monitoring stations, 45% of which were traffic stations.
Belgium, Italy and Poland reported exceedances of the NO2 annual limit value based on assessment models for three, two and four air quality zones, respectively.
Note: The figure shows, per country, the concentrations of each reported station, the minimum and maximum concentrations, the median and the 25th and 75th percentiles of all the measurements (annual mean NO2 concentrations).
In 2023, 1% of monitoring stations registered concentrations of NO2 above the annual limit value, all of which were traffic stations. 68% of monitoring stations registered concentrations above the WHO annual guideline level, 46% of which were traffic stations.
Benzo(a)pyrene (BaP) is a carcinogenic pollutant emitted mainly from the combustion of coal and wood for heating and, to a lesser extent, from industrial installations and the combustion of agricultural waste.
The highest concentrations were found in Italy and eastern Europe (Map 5 and Figure 10), where the use of coal and other solid fuels for residential heating is widespread.
Source: EEA’s AQ e-reporting database
Country status for BaP in 2022: 12 out of 27 reporting countries, all of which were EU Member States, registered values above 1.0 ng/m3. Concentrations above 1.0 ng/m3 were registered at 25% of the reported monitoring stations, the majority of which were urban (78%) or suburban (18%). Greece and Poland reported exceedances of the BaP target value based on assessment models for one and 32 air quality zones, respectively.
Note: The figure shows, per country, the concentrations of each reported station, the minimum and maximum concentrations, the median and the 25th and 75th percentiles of all the measurements (annual mean BaP concentrations).
Country status for sulphur dioxide (SO2) in 2022:
- 4 out of 37 reporting countries (Bosnia and Herzegovina, Türkiye, North Macedonia and Serbia) — none of them EU Member States — registered levels above the EU daily limit value of 125µg/m3;
- 17 countries, including nine EU Member States, registered values above the WHO daily guideline level of 40µg/m3 [5] .
In 2022, 1% of reporting monitoring stations registered concentrations above the EU daily limit value and 6% of stations registered concentrations above the WHO daily guideline level.
In 2023, 11 reporting stations outside the EU (nine in Bosnia and Herzegovina and two in North Macedonia) registered concentrations of SO2 above the EU daily limit value. In the same year, concentrations above the WHO daily guideline level were registered in 13 countries (including 10 EU Member States) out of 33 reporting countries.
Concentrations above the corresponding EU limit or target values were also registered in 2022 for the following pollutants:
- carbon monoxide (CO) at one station, located in the non-EU Member State of Serbia, out of 35 reporting countries;
- for benzene and lead, no stations reported concentrations above EU annual limit values in the 28 and 30 reporting countries, respectively. Italy reported exceedances of the benzene annual limit value based on assessment models for one air quality zone;
- arsenic in six stations across three EU Member States (Belgium, Finland and Poland, with two stations each) out of 29 reporting countries. Poland reported exceedances of the arsenic annual target value based on assessment models for two air quality zones;
- cadmium at one station, located in the EU Member State of Bulgaria, out of 30 reporting countries;
- nickel in four stations located in four EU Member States (Finland, France, Germany and Italy) out of 29 reporting countries.


Document Actions
Share with others